Differences in Cesarean Delivery Rates for Puerto Rican Mothers in Puerto Rico and the U.S. Mainland, 2023
NCHS Data Brief No. 523, January 2025
PDF Version (1,083 KB)
Michelle J.K. Osterman, M.H.S., and Maria M. Juiz Gallego, M.P.H.E., C.H.E.S.
- Key findings
- The cesarean delivery rates for Puerto Rican mothers in Puerto Rico was higher than rates for Puerto Rican mothers in the U.S. mainland overall and for all maternal age groups.
- Cesarean delivery rates for Puerto Rican mothers in Puerto Rico were higher than rates for Puerto Rican mothers in the U.S. mainland for all gestational ages except early preterm.
- Cesarean delivery rates for Puerto Rican mothers in Puerto Rico were higher than rates for Puerto Rican mothers in the U.S. mainland for all sources of payment for the delivery.
- The cesarean delivery rate for Puerto Rican mothers in Puerto Rico was higher than the rate for Puerto Rican mothers in most states and the District of Columbia.
Data from the National Vital Statistics System
- The cesarean delivery rate for Puerto Rican mothers in Puerto Rico was 50.9% in 2023, 51% higher than that for Puerto Rican mothers in the U.S. mainland, 33.8%.
- In 2023, cesarean delivery rates for Puerto Rican mothers in Puerto Rico were higher for all maternal age groups than rates for Puerto Rican mothers in the U.S. mainland.
- Cesarean delivery rates for most gestational age categories were higher for Puerto Rican mothers in Puerto Rico than in the U.S. mainland in 2023.
- Cesarean delivery rates for Puerto Rican mothers in Puerto Rico were higher than in the U.S. mainland for all source of payment categories.
- The cesarean delivery rate for Puerto Rican mothers in Puerto Rico was higher than for Puerto Rican mothers in nearly all states and the District of Columbia.
Cesarean delivery is major surgery associated with higher costs and adverse outcomes compared with vaginal delivery (1–3). For the first time, in 2022 more than one-half of births in Puerto Rico were delivered by cesarean (50.5%) (4). In recent decades, cesarean delivery rates in Puerto Rico have been 40%–70% higher than rates in the U.S. mainland and up to 78% higher than rates for Hispanic mothers in the U.S. mainland (5,6). This report explores differences between the cesarean delivery rates for Puerto Rican mothers giving birth in Puerto Rico and the U.S. mainland in 2023, by maternal age, gestational age, source of payment for the delivery, and state of occurrence.
Keywords: method of delivery, gestational age, age of mother, National Vital Statistics System
The cesarean delivery rates for Puerto Rican mothers in Puerto Rico were higher than rates for Puerto Rican mothers in the U.S. mainland overall and for all maternal age groups.
- The cesarean delivery rate for Puerto Rican mothers in Puerto Rico was 50.9% in 2023, 51% higher than that for Puerto Rican mothers in the U.S. mainland (33.8%) (Figure 1, Table 1).
- Cesarean delivery rates in each maternal age group for Puerto Rican mothers in Puerto Rico were higher than for Puerto Rican mothers in the U.S. mainland, but differences were larger among younger mothers: 39.5% compared with 18.9% for mothers younger than age 20 and 68.8% compared with 52.4% for mothers age 40 and older.
- Puerto Rican mothers in Puerto Rico were more likely to have a cesarean delivery compared with Puerto Rican mothers in the U.S. mainland among ages 20–29 (49.2% compared with 29.4%) and ages 30–39 (55.3% compared with 40.5%).
Figure 1. Cesarean delivery rate for Puerto Rican mothers, by maternal age group and place of occurrence, 2023
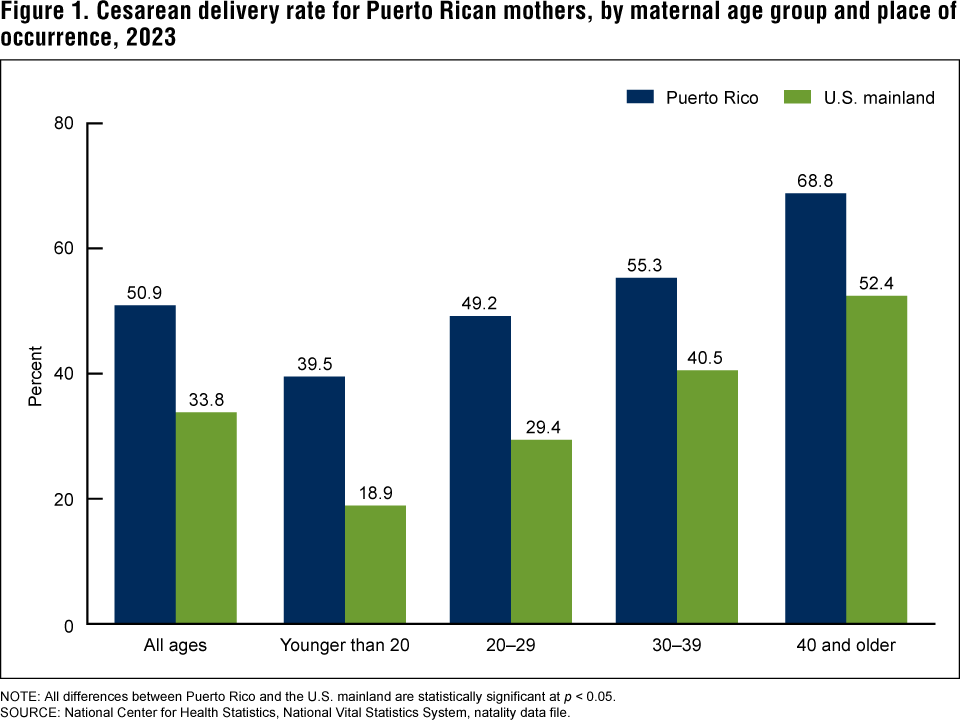
NOTE: All differences between Puerto Rico and the U.S. mainland are statistically significant at p < 0.05.
SOURCE: National Center for Health Statistics, National Vital Statistics System, natality data file.
Cesarean delivery rates for Puerto Rican mothers in Puerto Rico were higher than rates for Puerto Rican mothers in the U.S. mainland for all gestational ages except early preterm.
- For late preterm, early term, full term, and late- or post-term births, 2023 cesarean delivery rates in Puerto Rico were higher than rates in the U.S. mainland (Figure 2, Table 2). Rates were essentially the same for early preterm births.
- Cesarean delivery rates in Puerto Rico ranged from 66.0% among early preterm births to 49.1% among late- or post-term births and 49.0% among full-term births.
- In comparison, rates in the U.S. mainland ranged from 65.0% among early preterm births to 30.7% among late- or post-term births.
Figure 2. Cesarean delivery rate for Puerto Rican mothers, by gestational age and place of occurrence, 2023
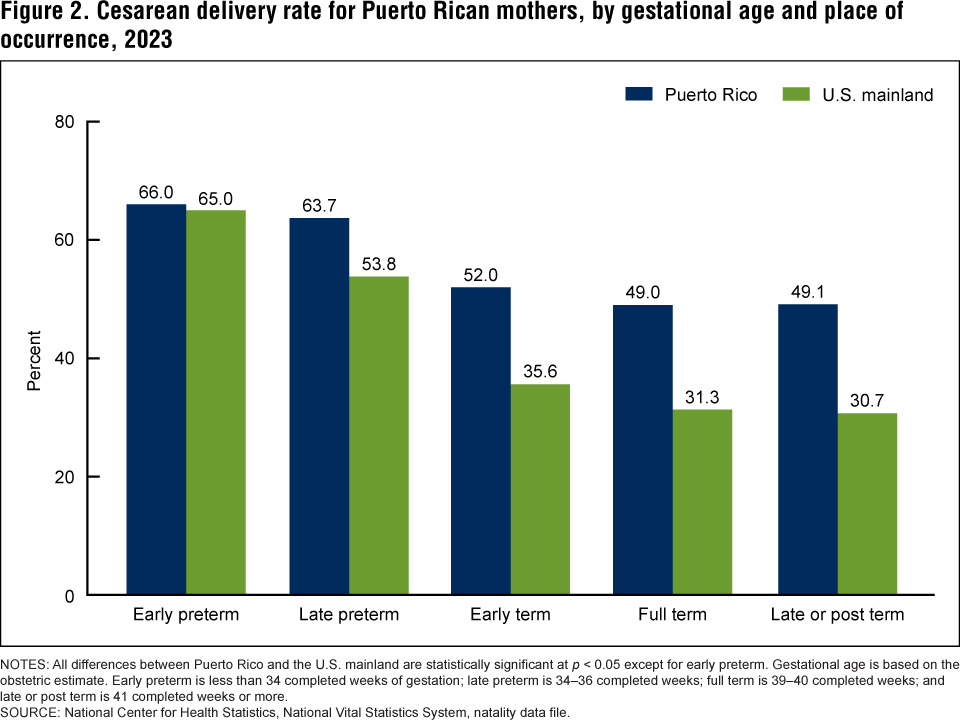
NOTES: All differences between Puerto Rico and the U.S. mainland are statistically significant at p < 0.05 except for early preterm. Gestational age is based on the obstetric estimate. Early preterm is less than 34 completed weeks of gestation; late preterm is 34–36 completed weeks; full term is 39–40 completed weeks; and late or post term is 41 completed weeks or more.
SOURCE: National Center for Health Statistics, National Vital Statistics System, natality data file.
Cesarean delivery rates for Puerto Rican mothers in Puerto Rico were higher than rates for Puerto Rican mothers in the U.S. mainland for all sources of payment for the delivery.
- In 2023, the cesarean delivery rate for Puerto Rican mothers covered by private insurance in Puerto Rico was 51.3% compared with 34.2% for Puerto Rican mothers in the U.S. mainland (Figure 3, Table 3).
- For Puerto Rican mothers with Medicaid, the cesarean delivery rate in Puerto Rico was 49.9% compared with 32.3% for Puerto Rican mothers in the U.S. mainland.
- In Puerto Rico, 27.6% of Puerto Rican mothers who self-paid for delivery had a cesarean delivery compared with 20.0% of Puerto Rican mothers in the U.S. mainland.
Figure 3. Cesarean delivery rate for Puerto Rican mothers, by primary source of payment for delivery and place of occurrence, 2023
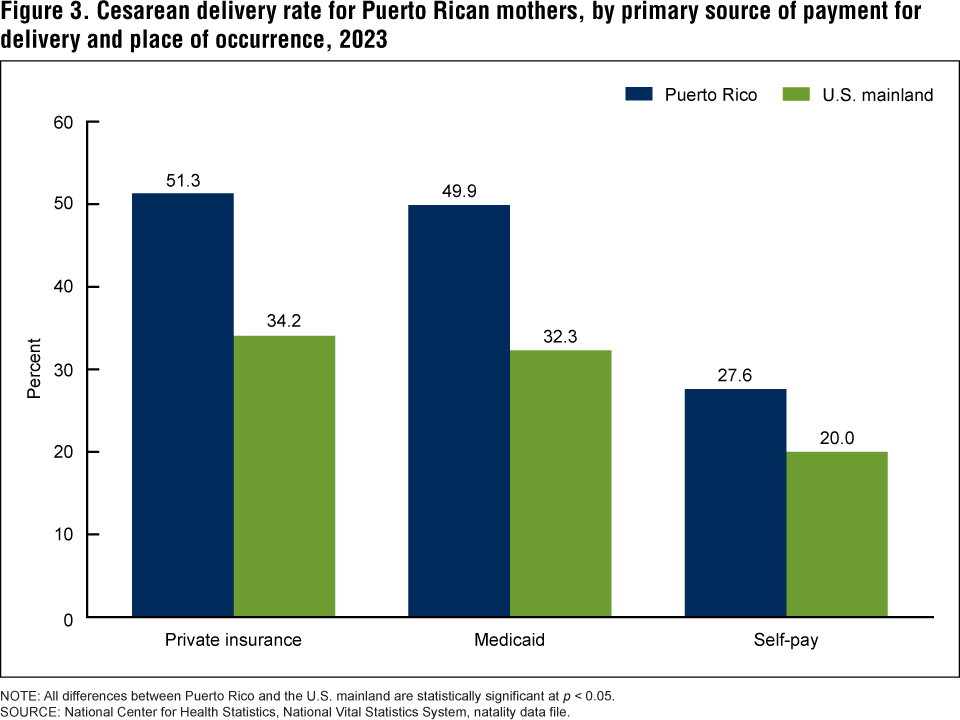
NOTE: All differences between Puerto Rico and the U.S. mainland are statistically significant at p < 0.05.
SOURCE: National Center for Health Statistics, National Vital Statistics System, natality data file.
The cesarean delivery rate for Puerto Rican mothers in Puerto Rico was higher than the rate for Puerto Rican mothers in most states and the District of Columbia.
- The cesarean delivery rate for Puerto Rican mothers in Puerto Rico (50.9%) was higher than the rate for Puerto Rican mothers in most states and the District of Columbia (D.C.) in 2023 (data for Montana, Vermont, and Wyoming did not meet reliability criteria) (Figure 4, Table 4).
- Cesarean delivery rates among Puerto Rican mothers in the United States ranged from 24.1% in South Dakota to 38.7% in Nebraska and West Virginia.
Figure 4. Cesarean delivery rate for Puerto Rican mothers in U.S. mainland, by state of occurrence, and Puerto Rico, 2023
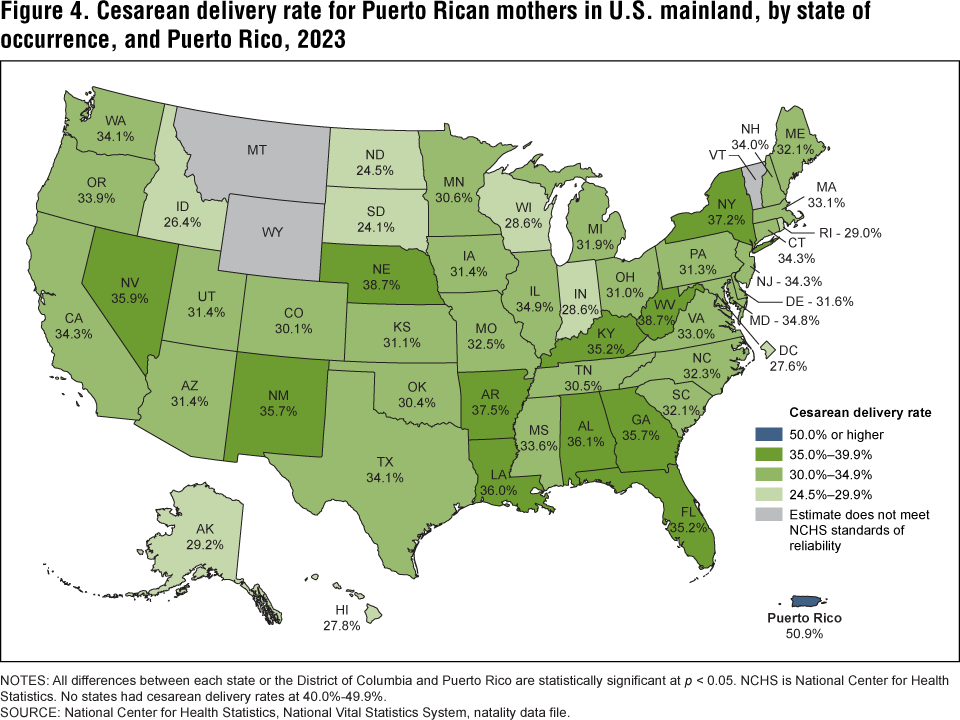
NOTES: All differences between each state or the District of Columbia and Puerto Rico are statistically significant at p < 0.05. NCHS is National Center for Health Statistics. No states had cesarean delivery rates at 40.0%-49.9%.
SOURCE: National Center for Health Statistics, National Vital Statistics System, natality data file.
Summary
In 2023, more than one-half of births to Puerto Rican mothers in Puerto Rico were delivered by cesarean delivery (50.9%) compared with just over one-third of births to Puerto Rican mothers in the U.S. mainland (33.8%). Cesarean delivery rates for Puerto Rican mothers in Puerto Rico were higher than rates in the U.S. mainland for all maternal age groups, all gestational ages except early preterm, all sources of payment for the delivery (private insurance, Medicaid, and self-pay), and all states with statistically reliable data and D.C.
The cesarean delivery rate for non-Puerto Rican mothers in Puerto Rico was also higher than non-Puerto Rican mothers in the U.S. mainland (45.1% and 32.3%, respectively) in 2023, as was the low-risk cesarean delivery rate (49.4% compared with 28.3%) (6,7). Additionally, among Puerto Rican mothers in the U.S. mainland, rates were similar between those born in Puerto Rico (34.5%) and those born in the 50 states or D.C. (33.6%) (6).
Definitions
- Cesarean delivery: Extraction of the infant, placenta, and membranes through an incision in the maternal abdominal and uterine walls.
- Cesarean delivery rate: Number of births delivered by cesarean per 100 births.
- Early preterm: Births delivered at less than 34 completed weeks of gestation based on the obstetric estimate.
- Late preterm: Births delivered at 34 to 36 completed weeks of gestation based on the obstetric estimate.
- Early term: Births delivered at 37 to 38 completed weeks of gestation based on the obstetric estimate.
- Full term: Births delivered at 39 to 40 completed weeks of gestation based on the obstetric estimate.
- Late or post term: Births delivered at 41 completed weeks or more of gestation based on the obstetric estimate.
- Principal source of payment for the delivery: The principal form of payment for the delivery at the time of delivery. Four options are identified in a checkbox format on the U.S. Standard Certificate of Live Birth:
- Private insurance: Includes providers such as Blue Cross Blue Shield and Aetna.
- Medicaid: Includes state programs comparable with Medicaid.
- Self-pay: No third-party payer identified; generally considered uninsured.
- Other: Includes Indian Health Service, TRICARE (formerly known as CHAMPUS), other government programs, and miscellaneous payment sources.
Data source and methods
This report uses data from the National Vital Statistics System natality data file. Information for Puerto Rico is based on data from birth certificates and includes all births occurring in Puerto Rico to residents of Puerto Rico who self-reported Puerto Rican ethnicity (94.4% of births in Puerto Rico in 2023) with known method of delivery (17,547 births in 2023). Information for the U.S. mainland is based on data for births occurring in the 50 states and D.C. to residents of the 50 states and D.C. who self-reported Puerto Rican ethnicity (1.8% of U.S. births in 2023) with known method of delivery (66,186 births in 2023).
Differences noted in the text are statistically significant at the 0.05 level unless otherwise noted, based on a pairwise comparison that was assessed using a two-tailed z test.
About the authors
Michelle J.K. Osterman is with the National Center for Health Statistics, Division of Vital Statistics. Maria M. Juiz Gallego is with the Puerto Rico Department of Health Demographic Registry, Quality of Vital Statistics Division.
References
- Yang Q, Wen SW, Oppenheimer L, Chen XK, Black D, Gao J, Walker MC. Association of caesarean delivery for first birth with placenta praevia and placental abruption in second pregnancy. BJOG 114(5):609–13. 2007.
- Kuklina EV, Meikle SF, Jamieson DJ, Whiteman MK, Barfield WD, Hills SD, Posner SF. Severe obstetric morbidity in the United States: 1998–2005. Obstet Gynecol 113(2 Part 1):293–9. 2009.
- Liston FA, Allen VM, O’Connell CM, Jangaard KA. Neonatal outcomes with cesarean delivery at term. Arch Dis Child Fetal Neonatal Ed 93(3):F176–82. 2008.
- Osterman MJK, Juiz Gallego MM. Trends in cesarean delivery in Puerto Rico, 2018–2022. NCHS Data Brief, no 486. Hyattsville, MD: National Center for Health Statistics. 2024. DOI: https://dx.doi.org/10.15620/cdc:134515.
- Centers for Disease Control and Prevention. Rates of cesarean delivery among Puerto Rican women—Puerto Rico and the U.S. mainland, 1992–2002. MMWR Morb Mortal Wkly Rep 55(3):68–71. 2006.
- National Center for Health Statistics. Birth data files. Published annually.
- Osterman MJK, Hamilton BE, Martin JA, Driscoll AK, Valenzuela CP. Births: Final data for 2023. National Vital Statistics Reports; vol 74, no 1. Hyattsville, MD: National Center for Health Statistics. 2025 [Forthcoming].
Suggested citation
Osterman MJK, Juiz Gallego MM. Differences in cesarean delivery rates for Puerto Rican mothers in Puerto Rico and the U.S. mainland, 2023. NCHS Data Brief, no 523. Hyattsville, MD: National Center for Health Statistics. 2025. DOI: https://dx.doi.org/10.15620/cdc/174574.
Copyright information
All material appearing in this report is in the public domain and may be reproduced or copied without permission; citation as to source, however, is appreciated.
National Center for Health Statistics
Brian C. Moyer, Ph.D., Director
Amy M. Branum, Ph.D., Associate Director for Science
Division of Vital Statistics
Paul D. Sutton, Ph.D., Director
Andrés A. Berruti, Ph.D., M.A., Associate Director for Science