Key points
- Valley fever is most common in California and Arizona.
- Each year around 20,000 cases of Valley fever are reported in the United States.
- It is underdiagnosed; thousands of cases are not reported.
- The estimated true burden is around 206,000-360,000 cases per year, 10-18 times more than reported.
Public health surveillance
Valley fever (coccidioidomycosis) is reportable in select states. Health departments collect and send information on cases to CDC through the National Notifiable Diseases Surveillance System (NNDSS).
Valley fever is most common in the southwestern United States. Check with your local, state, or territorial health department for more information about disease reporting requirements in your area.
Rates and trends of reported cases
Cases reported in 2023
- Roughly 20,000 cases are reported to CDC each year.
- Rates are highest among people 60 years and older.
- Causes around 15% to 30% of community-acquired pneumonias in Phoenix and Tucson metropolitan areas.
*Provisional data
Reported Valley fever cases, 1998-2022
Data table
Cases reported each year by state: Arizona, California, Nevada/New Mexico/Utah, and other states.
The numbers reported here represent finalized annual NNDSS data. Numbers for 2023 are provisional. Case counts reported by individual states might differ slightly from those reported here. This is because of differences in the timing of reports or surveillance methods.
| Year | Arizona | California | Nevada, New Mexico, and Utah | Other states | Total |
|---|---|---|---|---|---|
| 1998 | 1,474 | 719 | 72 | 6 | 2,271 |
| 1999 | 1,812 | 939 | 55 | 20 | 2,826 |
| 2000 | 1,917 | 840 | 67 | 41 | 2,865 |
| 2001 | 2,301 | 1,538 | 63 | 30 | 3,932 |
| 2002 | 3,133 | 1,727 | 64 | 44 | 4,968 |
| 2003 | 2,695 | 2,091 | 55 | 29 | 4,870 |
| 2004 | 3,667 | 2,641 | 110 | 31 | 6,449 |
| 2005 | 3,516 | 2,885 | 108 | 33 | 6,542 |
| 2006 | 5,535 | 3,131 | 140 | 111 | 8,917 |
| 2007 | 4,832 | 2,991 | 163 | 135 | 8,121 |
| 2008 | 4,768 | 2,597 | 99 | 59 | 7,523 |
| 2009 | 10,233 | 2,488 | 147 | 58 | 12,926 |
| 2010 | 11,883 | 4,622 | 159 | 129 | 16,793 |
| 2011 | 16,467 | 5,697 | 237 | 233 | 22,634 |
| 2012 | 12,920 | 4,431 | 211 | 240 | 17,802 |
| 2013 | 5,861 | 3,272 | 162 | 143 | 9,438 |
| 2014 | 5,624 | 2,243 | 156 | 209 | 8,232 |
| 2015 | 7,622 | 3,053 | 198 | 199 | 11,072 |
| 2016 | 6,101 | 5,358 | 151 | 219 | 11,829 |
| 2017 | 6,885 | 6,925 | 279 | 275 | 14,364 |
| 2018 | 7,478 | 7,546 | 276 | 311 | 15,611 |
| 2019 | 10,359 | 9,004 | 350 | 290 | 20,003 |
| 2020 | 11,527 | 7,090 | 294 | 309 | 19,220 |
| 2021 | 11,489 | 8,058 | 258 | 397 | 20,202 |
| 2022 | 9,515 | 7,459 | 284 | 354 | 17,612 |
| 2023 | 10,990 | 9,060 | 566 | 555 | 21,171 |
Death rates
On average, there were approximately 200 coccidioidomycosis-associated deaths reported each year from 1999-2023. Deaths are considered coccidioidomycosis-associated anytime coccidioidomycosis is listed as a primary or contributing cause on a death certificate.
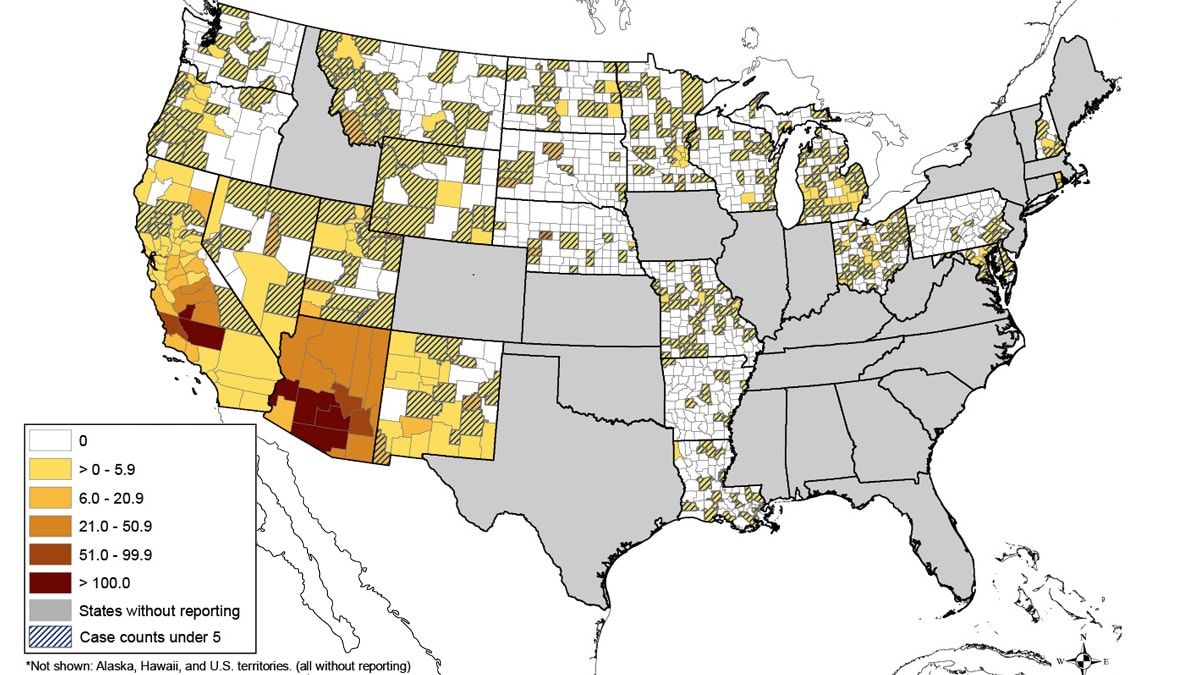
Map of reported cases
Average incidence of reported Valley fever per 100,000 people, by county, during 2011–2017
Note:
- Rates in counties with <5 reported cases might not be reliable.
- Cases are classified by county of residence.
- Cases infected while traveling are attributed to county of residence.
Estimated true burden
Valley fever is underestimated due to misdiagnoses, underdiagnoses, and lack of care seeking. CDC scientists developed a model accounting for these factors. The model was used to estimate the true number of cases, hospitalizations, and deaths— collectively referred to as the burden.
Estimated true burden of Valley fever
- 206,000–360,000 symptomatic cases; 10-18 times more cases than reported.
- 18,000–28,000 hospitalizations; 2-3 times more than found in national data.
- 700–1,100 deaths; 5-6 times more deaths than reported.
Research on year-to-year changes
The reasons for the year-to-year changes in the number of reported Valley fever cases are not entirely known.
Factors that could explain these changes include:
- The number of people who travel or relocate to endemic areas.
- Environmental factors such as temperature and rainfall.
- These affect the growth and circulation of the fungus.
- The way cases are being detected and reported.
Find more information about the increase in cases in California during 2016 and Arizona during 2017–2018.