 |
|
|
|
|
|
|
| ||||||||||
|
|
|
|
|
|
|
||||
| ||||||||||
|
|
|
|
Abortion Surveillance -- United States, 1993 and 1994Lisa M. Koonin, M.N., M.P.H., Jack C. Smith, M.S., Merrell Ramick, Lilo T. Strauss, M.A., Frederick W. Hopkins, M.D., M.P.H. Division of Reproductive Health National Center for Chronic Disease Prevention and Health Promotion Abstract Condition: From 1991 through 1994, the number of legal induced abortions reported to CDC declined each year by less than or equal to 5% from the number reported for the preceding year. Reporting Period Covered: This report summarizes and reviews information reported to CDC regarding legal induced abortions obtained in the United States during 1993 and 1994. This analysis also includes recently reported abortion-related deaths that occurred during 1991. Description of System: For each year since 1969, CDC has compiled abortion data received from 52 reporting areas: 50 states, the District of Columbia, and New York City. Results: In 1993, 1,330,414 legal abortions were reported to CDC, representing a 2.1% decrease from the number reported for 1992; in 1994, 1,267,415 abortions were reported, representing a 4.7% decrease from the number for 1993. In 1993 and 1994, the abortion ratio was 334 and 321 legal induced abortions per 1,000 live births, respectively. In 1993, the abortion rate was 22 per 1,000 women aged 15-44 years; in 1994, this rate declined to 21 per 1,000 women. Women who were undergoing an abortion were more likely to be young, white, and unmarried; most were obtaining an abortion for the first time. More than half of all abortions (52%-54%) were performed at less than or equal to 8 weeks of gestation, and approximately 88% were before 13 weeks. Approximately 15%-16% of abortions were performed at less than or equal to 6 weeks of gestation, 16% were performed at 7 weeks, and 22% at 8 weeks. Younger women (i.e., women aged less than or equal to 19 years) were more likely to obtain abortions later in pregnancy than were older women. In 1991, 12 women died as a result of induced abortion: 11 of these deaths were related to legal abortion and one to illegal abortion. During 1991, the case-fatality rate of legal induced abortion was 0.8 abortion-related deaths per 100,000 legal induced abortions. Interpretation: Since 1990, the number of abortions has declined each year. Since 1987, the abortion-to-live-birth ratio also has declined; in 1994, it was the lowest recorded since 1977. This decrease in the abortion ratio reflected the lower proportion of pregnant women who obtained an induced abortion. As in previous years, deaths related to legal induced abortions occurred rarely (i.e., approximately one death per 100,000 legal induced abortions). Actions Taken: The number and characteristics of women who obtain abortions in the United States should continue to be monitored so that trends in induced abortion can be assessed, efforts to prevent unintended pregnancy can be evaluated, and the preventable causes of morbidity and mortality associated with abortions can be identified and reduced. INTRODUCTION In 1969, CDC began abortion surveillance to document the number and characteristics of women obtaining legal induced abortions, monitor unintended pregnancy, and assist efforts to identify and reduce preventable causes of morbidity and mortality associated with abortions. This report is based primarily on abortion data for 1993 and 1994 provided to CDC's National Center for Chronic Disease Prevention and Health Promotion, Division of Reproductive Health. METHODS For 1993 and 1994, CDC compiled data from 52 reporting areas: 50 states, the District of Columbia, and New York City. The total number of legal induced abortions was available from all reporting areas; however, not all these areas collected information regarding the characteristics of women who obtained abortions, and the number of states reporting each characteristic differed. States were excluded from the analysis if data regarding a given characteristic were unknown for greater than 15% of women. For 47 reporting areas, data concerning the number and characteristics of legal induced abortions were provided from the central health agency *; for the other five areas, data concerning the number of abortions were provided from hospitals and other medical facilities. Because information concerning the residence of women who obtained abortions was not available from some states, the procedures were reported by the state in which they were performed. However, two reporting areas (the District of Columbia and Wisconsin) reported abortions by state of residence; occurrence data were unavailable for those areas. For the analysis of age, women who obtained legal induced abortions were grouped by 5-year age groups. Both ratios (i.e., the number of abortions per 1,000 live births per year) and rates (the number of abortions per 1,000 women per year) are presented by age group in this report. Ratios were calculated by using the number of live births provided by each state's central health agency (except where noted), and rates were calculated by using the number of women reported in special unpublished tabulations provided by the U.S. Bureau of the Census. Because almost all (94%) abortions among women less than 15 years of age are obtained by those aged 13-14 years (1), the population of women aged 13-14 years was used as the denominator for calculating abortion rates for women aged less than 15 years. Rates for women aged greater than or equal to 40 years were based on the number of women aged 40-44 years, whereas rates for all women who obtained abortions were based on the population of women aged 15-44 years. Race was categorized by either three groups (i.e., a} white, b} black, and c} all other races) or two groups (i.e., a} white and b} black and all other races). "Other" races included Asian/Pacific Islander, Native American/Alaskan Native, and women classified as "other" race. In 1990, data regarding Hispanic ethnicity were first available on abortion reports submitted by central health agencies to CDC. For the purposes of this surveillance system, Hispanic ethnicity and race were evaluated separately. For the analysis of abortions by race, women of Hispanic ethnicity were categorized as white. Marital status was reported as either married (which included women who were married or separated) or unmarried (which usually included those who were unmarried, divorced, or widowed). Reporting of marital status differed somewhat by state, particularly for the data used as denominators to calculate abortion ratios by marital status; therefore, abortion ratios by marital status should be interpreted cautiously. Most areas that reported week of gestation at the time of abortion also reported procedures obtained at less than or equal to 8 weeks of gestation (38 of 41 in 1993 and 38 of 40 in 1994). Gestational age (in weeks) at the time of abortion was reported by most areas from estimates derived from the time elapsed since the woman's last menstrual period. In 10 states in 1993 and 17 states in 1994, gestational age was reported on the basis of the physician's estimate, which could have included information from the clinical examination as well as the time elapsed since the last menstrual period. CDC periodically has reported information concerning abortion-related deaths; the first year for which such data were available was 1972 (2). Sources for obtaining such information included national and state vital records, maternal mortality review committees, surveys, private citizens, the media, health-care providers, and medical examiner reports. For each reported case, clinical records and autopsy reports were requested and reviewed by a medical epidemiologist to determine the cause of death and verify that the death was abortion-related. An abortion-related death was defined as a death resulting from a) a direct complication of an abortion, b) an indirect complication caused by the chain of events initiated by the abortion, or c) aggravation of a preexisting condition by the physiologic or psychologic effects of the abortion. Each abortion-related death was then categorized as legal induced, illegal induced, spontaneous, or unknown. Deaths that did not satisfy the criteria of the case definition were classified as not abortion-related. * Legal induced abortion was defined as a procedure, performed by a licensed physician or someone acting under the supervision of a licensed physician, that was intended to terminate a suspected or known intrauterine pregnancy and to produce a nonviable fetus at any gestational age (3,4). Before 1978, no gestational age criteria were specified for classifying spontaneous abortion-related deaths. For the reporting year 1978, CDC defined spontaneous abortion as occurring before the completion of the twentieth menstrual week (4). A detailed review of all spontaneous abortion-related deaths during 1978-1989 resulted in the identification of seven deaths that had occurred at greater than or equal to 20 weeks of gestation; these deaths were reclassified as not abortion-related. Included in this report are a) abortion-related deaths that occurred during 1991 and b) updated totals for spontaneous abortion-related deaths for 1979, 1980, 1982, 1984, 1988, and 1989 (2,5). Case-fatality rates were calculated for legal induced abortion-related deaths per 100,000 legal induced abortions. Trends in case-fatality rates for legal induced abortion for 1972-1991 are reported. RESULTS For 1993, 1,330,414 legal induced abortions were reported to CDC, representing a 2.1% decrease from the number reported for 1992 (5); for 1994, 1,267,415 abortions were reported, representing a 4.7% decrease from the number for 1993 (Table_1). In contrast, from 1970 through 1982, the reported number of legal abortions in the United States had increased every year (Table_2), (Figure_1); the largest percentage increase occurred from 1970 to 1971. From 1976 through 1982, the annual increase declined continuously and reached a low of 0.2% for both 1981 and 1982. From 1983 through 1990, the number of abortions increased again, although year-to-year fluctuations were less than or equal to 5%. From 1991 through 1994, the annual number of abortions decreased each year. The legal induced abortion ratio increased from 1970 to 1980, peaked at 364 abortions per 1,000 live births in 1984, and began to decline steadily after 1987 (to 334 per 1,000 in 1993 and to 321 per 1,000 in 1994) (Figure_1), (Table_2). The legal induced abortion rate increased from five abortions per 1,000 women aged 15-44 years in 1970 to 25 per 1,000 in 1980. From 1981 through 1992, the rate remained stable at 23-24 abortions per 1,000 women, then declined to 22 in 1993 and to 21 in 1994. In 1993 and 1994, as in previous years, most legal induced abortions were performed in California, Florida, New York City, and Texas; the fewest were performed in Idaho, North Dakota, South Dakota, and Wyoming (Table_3) and (Table_4)) (2,6,7). For women whose state of residence was known, approximately 91% had obtained the abortion within the state in which they resided. In 1994, the percentage of abortions obtained by out-of-state residents ranged from approximately 52%-54% in the District of Columbia to less than 1% in Hawaii. For both 1993 and 1994, nine reporting areas did not provide data concerning abortions obtained by out-of-state residents. Women aged 20-24 years obtained approximately one third (34% in 1993 and 33% in 1994) of all abortions; women aged less than 15 years obtained less than 1% of all abortions (Table_5) and (Table_6). Abortion ratios were highest for women in the youngest (i.e., less than 15 years and 15-19 years) and the oldest (greater than or equal to 40 years) age groups (Figure_2). The abortion ratio for women aged less than 15 years was 744 abortions per 1,000 live births in 1993 and 704 per 1,000 in 1994. The ratio for women aged 15-19 years (440 and 415 abortions per 1,000 live births in 1993 and 1994, respectively) was similar to that for women aged greater than or equal to 40 years (430 and 412 abortions per 1,000 live births in 1993 and 1994, respectively). The ratio was lowest for women aged 30-34 years (180 and 172 abortions per 1,000 live births in 1993 and 1994, respectively). Among adolescents, the abortion ratio was highest for those aged less than 15 years and lowest for those aged 19 years (Table_7) and (Table_8). Abortion rates were highest for women aged 20-24 years (42 abortions per 1,000 women in 1993 and 39 per 1,000 in 1994) and lowest for women at the reproductive-age extremes (i.e., for women aged less than 15 years, three abortions per 1,000 women in 1993 and two per 1,000 in 1994; for women aged greater than or equal to 40 years, two abortions per 1,000 women in 1993 and 1994) (Table_5) and (Table_6). For women in most age groups, the abortion ratio increased from 1974 through the early to mid-1980s and declined thereafter, particularly for the youngest and oldest reproductive-aged women (Figure_3). The abortion ratios for women aged less than 15 years have been higher than for the other age groups. In 1994, the abortion ratio decreased for women aged 15-19 years and was the lowest ever recorded for that age group. The abortion ratio for women aged 20-34 years (i.e., the group with the highest fertility rate) has remained stable since the mid-1980s (8). During 1993 and 1994, approximately 51%-53% of reported legal induced abortions were obtained at less than or equal to 8 weeks of gestation, and about 86% were obtained at less than 13 weeks (Table_9) and (Table_10). In 1993 and 1994, approximately 14%-15% of abortions were performed at less than or equal to 6 weeks of gestation, approximately 16% at 7 weeks, and approximately 21% at 8 weeks (Table_11) and (Table_12). Few abortions were provided after 15 weeks of gestation -- approximately 4% of abortions were obtained at 16-20 weeks, and 1.2%-1.3% were obtained at greater than or equal to 21 weeks (Figure_4). During both 1993 and 1994, approximately 98% of legal induced abortions were performed by curettage, and less than 1% by intrauterine saline or prostaglandin instillation (Table_13 and Table_14). Hysterectomy and hysterotomy seldom were used; less than 0.01% of abortions were performed by using these methods. As in previous years, approximately 60% of women who obtained legal induced abortions were white (Table_15) and (Table_16) (2,6). Abortion ratios for black women were 552 abortions per 1,000 live births in 1993 and 538 per 1,000 in 1994; these ratios were almost 2.5 times the ratios for white women (231 abortions per 1,000 live births in 1993 and 217 per 1,000 in 1994). Abortion ratios for women of other races (310 abortions per 1,000 live births in 1993 and 325 per 1,000 in 1994) were approximately 1.3-1.5 times the ratios for white women. In addition, abortion rates for black women (43 and 40 abortions per 1,000 black women in 1993 and 1994, respectively) were approximately three times the rates for white women (15 and 13 abortions per 1,000 white women in 1993 and 1994, respectively). Twenty-one states in 1993 and 22 states in 1994, the District of Columbia, and New York City * reported information concerning the Hispanic ethnicity of women who obtained legal induced abortions (Table_17) and (Table_18). The percentage of abortions obtained by Hispanic women in these reporting areas ranged from less than 1% in several states to approximately 39%-40% in New Mexico. For Hispanic women in these reporting areas, the abortion ratio was 289 abortions per 1,000 live births in 1993 and 278 per 1,000 in 1994 -- slightly lower than the ratio for non-Hispanics in the same areas (309 and 290 abortions per 1,000 live births in 1993 and 1994, respectively). However, the abortion rate per 1,000 Hispanic women (30 abortions per 1,000 women in 1993 and 29 per 1,000 in 1994) was greater than the rate per 1,000 non-Hispanic women (20 per 1,000 women in 1993 and 18 per 1,000 in 1994). Seventy-seven to 78 percent of women who obtained abortions were unmarried (Table_19) and (Table_20)). Abortion ratios for unmarried women were approximately nine times the ratios for married women (789 vs. 84 abortions per 1,000 live births in 1993, and 689 vs. 79 in 1994). Approximately 45%-46% of women who obtained legal induced abortions had had no previous live births, and about 88%-89% had had two or fewer previous live births (Table_21) and (Table_22). The abortion ratio in 1994 was highest for women who had had no previous live births and women who had had two previous live births. The ratio was lowest for women who had had one previous live birth. In 1993 and 1994, approximately 54% of women who obtained a legal abortion were doing so for the first time. Approximately 17%-18% of women who obtained a legal abortion had had at least two previous legal abortions (Table_23) and (Table_24). The age distribution of women who obtained a legal abortion differed only slightly by race (Table_25) and (Table_26). However, for women of black or other races, the percentage who were less than 15 years of age, although small (1.2%), was twice the percentage for white women (0.6%). The percentage of women of black or other races who were unmarried (82% in 1993 and 83% in 1994) also was slightly higher than the percentage of white women (77% in 1993 and 78% in 1994). Few differences were found by age and Hispanic ethnicity (Table_27) and (Table_28). Of those women who obtained an abortion, a slightly higher percentage of non-Hispanic women were unmarried in comparison with Hispanic women. Most women (88%) obtained an abortion during the first 12 weeks of pregnancy; however, adolescents (i.e., women aged less than or equal to 19 years) were more likely than older women to obtain abortions later in pregnancy (Table_29) and (Table_30). The percentage of women who obtained an abortion early in pregnancy (i.e., at less than or equal to 8 weeks of gestation) increased with age. The percentage who obtained an abortion late in pregnancy (at greater than or equal to 16 weeks of gestation) decreased with age for women up to 25-29 years of age, and then remained stable for women in older age groups (Figure_5). Black women were more likely to obtain an abortion later in pregnancy than were white women or women of other races (Table_29) and (Table_30). Although Hispanic women were slightly more likely than non-Hispanic women to have had an abortion at less than or equal to 8 weeks of gestation, the overall differences between Hispanic and non-Hispanic women in the timing of abortions were minimal (Table_29) (Table_30) (Table_31) and (Table_32). More than 99% of abortions at less than or equal to 12 weeks of gestation were performed by using curettage (primarily suction procedures) (Table_33) and (Table_34). After 12 weeks of gestation, the most frequently used procedure also was curettage, although it usually was reported as dilatation and evacuation (D&E). About the same proportion of intrauterine instillations involved the use of saline or prostaglandin; these procedures were used primarily at greater than or equal to 16 weeks of gestation. CDC received reports of 32 possible abortion-related deaths for 1991 (i.e., the most recent year for which such data were available). A review of these cases indicated that 18 of the 32 women died from abortion-related causes (Table_35). Eleven of the deaths were associated with legal induced abortion; one death, illegal induced abortion; and six deaths, spontaneous abortion. Possible abortion-related deaths that occurred during 1992-1994 are being investigated. All deaths reported to CDC for 1972-1990 that had been classified as "spontaneous abortion-related" were reviewed. Seven of these deaths had occurred during 1979-1989 among women at greater than or equal to 20 weeks of gestation. Because these deaths did not meet the criteria for spontaneous abortion-related deaths, they were reclassified as not abortion-related (i.e., pregnancy-related). The case-fatality rate for legal induced abortion in 1991 was 0.8 deaths per 100,000 legal abortions. During 1980-1991, annual case-fatality rates for legal induced abortion-related deaths were less than or equal to 1.2 deaths per 100,000 legal induced abortions (Table_35) , (Figure_6). DISCUSSION In the United States, the annual number of abortions has decreased each year since 1990 (i.e., the year in which the number of abortions was highest) (Table_2)) (2,6,7). In 1994, the national abortion-to-live-birth ratio was the lowest recorded since 1976. The abortion ratio had increased steadily from 1970 through 1980, decreased slightly during 1981-1983, increased to its highest level in 1984, then remained fairly stable until 1987, before beginning to decline (Table_2 , (Figure_1). This decline in the abortion-to-live-birth ratio probably resulted from several complex factors, such as reduced access to abortion services, changes in contraceptive practices, attitudinal changes concerning abortion and/or carrying unplanned pregnancies to term, and the decreased number of unintended pregnancies (9-12). Induced abortion rates in the United States for 1993-1994 were a) higher than rates reported previously by Australia and Western European countries and b) lower than rates reported by China, Cuba, Eastern European countries, and the New Independent States of the former Soviet Union (13). In addition, for 1994, the legal induced abortion rate in Canada was exactly half the rate in the United States (10.5 abortions per 1,000 women aged 15-44 years vs. 21 per 1,000, respectively), and the abortion-to-live-birth ratio in Canada also was approximately half the ratio in the United States (186 abortions per 1,000 live births vs. 321 per 1,000, respectively) (14). Both abortion rates and birth rates among teenagers have been higher in the United States than in most Western European countries and some Eastern European countries (15). As in previous years, the abortion ratio in 1993 and 1994 differed substantially by age (2,6). Although the abortion ratio was highest for adolescents, the percentage of legal induced abortions obtained by women aged less than or equal to 19 years decreased steadily from the mid-1980s through 1994 (i.e., from 26% in 1984 to 22% in 1990 and to 20% in 1994) (7,16). Since 1980, the abortion ratio has declined for most age groups -- particularly for women aged less than or equal to 19 years and greater than or equal to 35 years. In 1994, the abortion ratio for women aged 15-19 years was the lowest ratio CDC had ever recorded for that age group. Other studies indicated a decrease in pregnancies among women aged 15-19 years during 1991-1992 (17). Factors such as an overall decrease in the number of abortions, changing access to abortion services (10), and ongoing changes in abortion laws (e.g., parental consent or notification laws and mandatory waiting periods) -- all of which are likely to disproportionately affect adolescents -- could have affected this decline in the abortion ratio (18,19). In 1993 and 1994, the abortion ratio for black women was more than twice the ratio for white women, and this differential has increased since 1986. In addition, the abortion rate for black women was approximately three times the rate for white women. Race-specific differences in legal induced abortion ratios and rates may reflect differences in factors such as socioeconomic status, contraceptive use, incidence of unintended pregnancies, and access to family planning and contraceptive services. The abortion-to-live-birth ratio for Hispanic women during 1993 and 1994 was slightly lower than that for non-Hispanic women. Other published reports indicate that pregnant Hispanic women are less likely than pregnant non-Hispanic women to obtain an abortion (20). However, the abortion rate per 1,000 Hispanic women was higher than the rate for non-Hispanic women, a finding that is consistent with several previously published reports (20,21). For women in all age groups, fertility was higher for Hispanic than for non-Hispanic women (8). For 1994, a total of 34 states, the District of Columbia, and New York City reported Hispanic ethnicity of women who obtained abortions. Because of concerns regarding the completeness of such information in some states, data from only 22 states, the District of Columbia, and New York City were evaluated to determine the number and percentage of abortions obtained by women of Hispanic ethnicity. These geographical areas represented approximately 44% of all reproductive-aged Hispanic women in the United States during 1994 (CDC, unpublished data). One published report of a study that used abortion data obtained from CDC also suggests that the number of Hispanic women who obtain abortions may be underestimated (21). Thus, the number, ratio, and rate of abortions for Hispanic women in this surveillance summary might not be representative of the overall Hispanic population in the United States (i.e., these data might reflect utilization of abortion services only in the states used for this analysis). The percentage distribution of abortions by gestational age was stable from 1980 through 1994, with slight increases toward the earliest and latest gestational ages (Table_1). Since 1992, most reporting areas have reported gestational age, in weeks of gestation, for abortions performed at less than or equal to 8 weeks (2). These data will assist in monitoring trends in legal abortions as new medical and surgical methods of terminating pregnancy are implemented, because these new methods are primarily for termination of pregnancies at less than or equal to 8 weeks of gestation (22-25). In this and previous reports, age was inversely associated with timing of abortion (2,26,27). Younger women were more likely to obtain an abortion later in gestation than were older women. From 1972 to 1994, the percentage of abortions performed by curettage (which includes D&E) increased from 89% to 99% ((Table_1|)), and the percentage of abortions performed by intrauterine instillation and by hysterectomy and hysterotomy declined sharply (from 10% to 0.5% and from 0.6% to less than 0.01%, respectively). From 1974 through 1994, the percentage of second-trimester abortions performed by D&E increased from 31% to 94%; the percentage of second-trimester abortions performed by intrauterine instillation decreased from 57% to 4% (28). The increasing reliance on D&E probably has resulted from the lower risk for complications associated with the procedure (29,30). Since CDC's surveillance of abortion mortality began in 1972, the annual number of deaths associated with legal induced abortion has decreased by 54% (as of 1991) (31). In 1972, 63 women died as a result of induced abortion. Of those deaths, 24 were associated with legal abortion and 39 with illegal abortion. In 1991, 12 women died as a result of induced abortion: 11 of these deaths were associated with legal abortion and one with illegal abortion. The case-fatality rate decreased approximately 80% between 1972 (4.1 deaths per 100,000 legal induced abortions) and 1991 (0.8 deaths per 100,000 legal induced abortions). These rates, consistent with previously published data for the 1970s and mid-1980s (32-34) indicated that the risk for death from legal induced abortion continues to be extremely low. The numbers, ratios, and rates of abortion from this analysis are conservative estimates because the numbers of legal abortions reported to CDC for 1993 and 1994 were probably lower than the numbers actually performed. Totals provided by central health agencies are often lower than those obtained by direct surveys of abortion providers (2). For example, the total number of abortions reported to CDC for 1992 * was approximately 11% lower than that reported by The Alan Guttmacher Institute (AGI), a private organization that directly contacts abortion providers to obtain information concerning the number of abortions performed (11). However, since 1987, there has been a decrease in the percentage difference in the number of abortions reported to AGI compared with the number reported to CDC. In addition, not all states collected and/or reported information (e.g., age, race, and gestational age) concerning women who obtained a legal induced abortion during 1993 and 1994; therefore, the numbers, percentages, rates, and ratios derived from this analysis may not be representative of all women who obtained abortions in those years. Despite these limitations, findings from ongoing national surveillance of legal induced abortion are used for several purposes. First, data from abortion surveillance are used to identify characteristics of women at high risk for unintended pregnancy. Second, ongoing annual surveillance is essential to monitor trends in the number, ratio, and rate of abortions in the United States. Third, statistics on the number of pregnancies ending in abortion are used in conjunction with birth statistics to estimate pregnancy rates (e.g., pregnancy rates among teenagers) (1) and other outcome rates (e.g., the rate of ectopic pregnancies per 1,000 pregnancies). Fourth, abortion and pregnancy rates can be used to evaluate the effectiveness of family planning programs and programs for preventing unintended pregnancy. Fifth, ongoing surveillance provides data for assessing changes in clinical practice patterns related to abortion (e.g., longitudinal changes in the types of procedures and trends in gestational age at the time of abortion). Finally, these data are used as the denominator in calculating abortion morbidity and mortality rates. Induced abortions are linked usually to unintended pregnancies, which often occur despite use of contraception (19,35,36). In 1995, approximately 31% of live births to women aged 15-44 years were associated with unintended pregnancy (i.e., either mistimed or unwanted at conception) (12). In one study during 1994 and 1995, 58% of women who underwent an abortion reported that they "currently used" contraception during the month of their last menstrual period; however, the use of contraception might have been inconsistent or incorrect (21). Therefore, education regarding improved contraceptive practices, as well as access to and education regarding safe, effective, and low-cost contraception and family planning services, can help reduce the incidence of unintended pregnancy and, therefore, reduce the use of legal induced abortion in the United States (37). Recently passed welfare-reform legislation -- the Personal Responsibility and Work Opportunity Reconciliation Act of 1996 *
Additional statistical and epidemiologic information about legal induced abortions is available from CDC's automated Reproductive Health Information System. This system provides information by fax, voice recordings, or mail; telephone (404) 330-1230. References
Figure_1  Return to top. Table_1 Note: To print large tables and graphs users may have to change their printer settings to landscape and use a small font size.
TABLE 1. Characteristics of women who obtained legal abortions -- United States, selected years, 1972-1994
================================================================================================================================================================
Characteristic                        1972      1973              1976        1980        1985        1990         1991        1992        1993        1994
----------------------------------------------------------------------------------------------------------------------------------------------------------------
Reported no. of  legal abortions   586,760   615,831           988,267   1,297,606   1,328,570   1,429,577    1,388,937   1,359,145   1,330,414   1,267,415

                                                                                             Percent distribution *
Residence                          -----------------------------------------------------------------------------------------------------------------------------
In-state                              56.2      74.8              90.0        92.6        92.4        91.8         91.6        92.0        91.4        91.5
Out-of-state                          43.8      25.2              10.0         7.4         7.6         8.2          8.4         8.0         8.6         8.5
Age (yrs)
    <=19                              32.6      32.7              32.1        29.2        26.3        22.4         21.0        20.1        20.0        20.2
   20-24                              32.5      32.0              33.3        35.5        34.7        33.2         34.4        34.5        34.4        33.5
    >=25                              34.9      35.3              34.6        35.3        39.0        44.4         44.6        45.4        45.6        46.3
Race
White                                 77.0      72.5              66.6        69.9        66.6        64.8         63.8        61.5        60.9        60.5
Black                                 23.0 +    27.5 +            33.4 +      30.1 +      29.8        31.8         32.5        33.9        34.9        34.7
Other &                                 --        --                --          --         3.5         3.4          3.7         4.6         4.2         4.8
Hispanic origin
Hispanic                                --        --                --          --          --         9.8         13.5        15.2        14.7        14.5
Non-Hispanic                            --        --                --          --          --        90.2         86.5        84.8        85.3        85.5
Marital status
Married                               29.7      27.4              24.6        23.1        19.3        21.7         21.4        20.8        20.4        19.9
Unmarried                             70.3      72.6              75.4        76.9        80.7        78.3         78.6        79.2        79.6        80.1
No. of live births @
  0                                   49.4      48.6              47.7        58.4        56.3        49.2         47.8        45.9        46.3        46.2
  1                                   18.2      18.8              20.7        19.4        21.6        24.4         25.3        25.9        26.0        25.9
  2                                   13.3      14.2              15.4        13.7        14.5        16.9         17.5        18.0        17.8        17.8
  3                                    8.7       8.7               8.3         5.3         5.1         6.1          6.4         6.7         6.6         6.7
>=4                                   10.4       9.7               7.9         3.2         2.5         3.4          3.0         3.5         3.3         3.4
Type of procedure
Curettage                             88.6      88.4              92.8        95.5        97.5        98.8         98.9        98.9        99.0        99.1
  Suction curettage                   65.2      74.9              82.6        89.8        94.6        96.0         97.3        97.0        96.4        96.5
  Sharp curettage                     23.4      13.5              10.2         5.7         2.9         2.8          1.6         1.9         2.6         2.6
Intrauterine instillation             10.4      10.4               6.0         3.1         1.7         0.8          0.7         0.7         0.6         0.5
Other **                               1.0       1.2               1.2         1.4         0.8         0.4          0.4         0.4         0.4         0.4
Wks of gestation
    <=8                               34.0      36.1              47.0        51.7        50.3        51.6         52.3        52.1        52.3        53.7
    <=6                                 --        --                --          --          --          --           --        14.3 ++     14.7 &&     15.7 @@
      7                                 --        --                --          --          --          --           --        15.6 ++     16.2 &&     16.5 @@
      8                                 --        --                --          --          --          --           --        22.2 ++     21.6 &&     21.6 @@
   9-10                               30.7      29.4              28.1        26.2        26.6        25.3         25.1        24.2        24.4        23.5
  11-12                               17.5      17.9              14.4        12.2        12.5        11.7         11.5        12.0        11.6        10.9
  13-15                                8.4       6.9               4.5         5.1         5.9         6.4          6.1         6.0         6.3         6.3
  16-20                                8.2       8.0               5.1         3.9         3.9         4.0          3.9         4.2         4.1         4.3
   >=21                                1.2       1.7               0.9         0.9         0.8         1.0          1.1         1.5         1.3         1.3
----------------------------------------------------------------------------------------------------------------------------------------------------------------
*  Based on known values in data from all areas reporting a given characteristic with no more than 15% unknowns. The number of areas reporting a given
   characteristic varied. For 1993, the number of areas included for residence
   was 43; age, 44; race, 36; ethnicity, 23; marital status, 37; number of live births, 39; type of procedure, 41; and weeks of gestation, 41. For
   1994, the number of areas included for residence was 43; age, 44; race, 37; ethnicity,
   24; marital status, 36; number of live births, 39; type of procedure, 41; and weeks of gestation, 40.
+  Reported as black and other races.
&  Includes all other races.
@  For 1972-1976, data indicate number of living children.
** Includes hysterotomy and hysterectomy.
++ Data are for 36 of 39 areas reporting weeks of gestation.
&& Data are for 38 of 41 areas reporting weeks of gestation.
@@ Data are for 38 of 40 areas reporting weeks of gestation.
-- Not available.
================================================================================================================================================================
Return to top. Table_2 Note: To print large tables and graphs users may have to change their printer settings to landscape and use a small font size.
TABLE 2. Number, ratio, * and rate + of legal abortions and source of reporting -- United States, 1970-1994
===========================================================================================================
                                                                No. of areas reporting
                                                   --------------------------------------------------------
Year   Total no. of legal abortions  Ratio    Rate   Central health agency &    Hospitals/ Facilities @
-----------------------------------------------------------------------------------------------------------
1970              193,491              52       5              18                         7
1971              485,816             137      11              19                         7
1972              586,760             180      13              21                         8
1973              615,831             196      14              26                        26
1974              763,476             242      17              37                        15

1975              854,853             272      18              39                        13
1976              988,267             312      21              41                        11
1977            1,079,430             325      22              46                         6
1978            1,157,776             347      23              48                         4
1979            1,251,921             358      24              47                         5

1980            1,297,606             359      25              47                         5
1981            1,300,760             358      24              46                         6
1982            1,303,980             354      24              46                         6
1983            1,268,987             349      23              46                         6
1984            1,333,521             364      24              44                         8

1985            1,328,570             354      24              44                         8
1986            1,328,112             354      23              43                         9
1987            1,353,671             356      24              45                         7
1988            1,371,285             352      24              45                         7
1989            1,396,658             346      24              45                         7

1990            1,429,577             345      24              46                         6
1991            1,388,937             339      24              47                         5
1992            1,359,145             335      23              47                         5
1993            1,330,414             334      22              47                         5
1994            1,267,415             321      21              47                         5
-----------------------------------------------------------------------------------------------------------
* Number of abortions per 1,000 live births.
+ Number of abortions per 1,000 women 15-44 years of age.
& Abortion data reported by central health agencies, which include state health departments and the health
  departments of New York City and the District of Columbia.
@ Abortion data reporte by hospitals and/or other medical facilities in state.
===========================================================================================================
Return to top. Table_3 Note: To print large tables and graphs users may have to change their printer settings to landscape and use a small font size.
TABLE 3. Reported number,* ratio,+ and rate& of legal abortions and percentage of abortions obtained by out-of-state residents,@ by
state of occurrence -- United States, 1993
======================================================================================================================================
                                                                                     Percentage of legal abortions
                                                                                       obtained by out-of-state
State               Total no. of legal abortions       Ratio             Rate                  residents
--------------------------------------------------------------------------------------------------------------------------------------
Alabama                        14,494                   235               15                      9.1
Alaska                          1,644 **                148               12                      --
Arizona                        13,648                   198               16                      2.6
Arkansas                        5,582                   163               11                      3.5
California                    323,944 ++                554               45                      --
Colorado                       10,115                   187               12                      9.2
Connecticut                    16,690                   358               22                      3.9
Delaware                        5,037                   477               31                      --
Dist. of Columbia              17,485                    -- &&            -- @@                  54.2
Florida                        70,069                   364               24                      --
Georgia                        37,819                   342               22                      9.1
Hawaii                          5,835                   298               22                      0.4
Idaho                           1,346                    77                6                      8.1
Illinois                       56,552                   297               21                      --
Indiana                        11,330                   135                9                      3.0
Iowa                            6,324 **                167               10                      --
Kansas                         10,977                   294               20                     44.2
Kentucky                        8,453                   159 ***           10                     24.1
Louisiana                      12,373                   178               12                      --
Maine                           3,301                   219               12                      5.3
Maryland                       19,318                   258               16                      7.1
Massachusetts                  35,312                   417               25                      4.4
Michigan                       35,737                   258               16                      3.9
Minnesota                      14,350                   222               14                      9.5
Mississippi                     6,002                   142               10                     19.6
Missouri                       12,540                   167               11                      9.0
Montana                         2,645                   233               15                     14.1
Nebraska                        5,486                   237               15                     19.0
Nevada                          6,955                   306               23                     11.4
New Hampshire                   3,057 **                198               11                      --
New Jersey                     36,508                   310               20                      2.0
New Mexico                      5,381                   193               15                      4.7
New York                      157,891                   570               38                      --
  City+++                     110,435 &&&               890               --                      6.8
  State+++                     47,456                   311               --                      6.5
North Carolina                 34,906                   344               22                      9.8
North Dakota                    1,406                   162               10                     35.3
Ohio                           41,673                   262               16                      8.7
Oklahoma                       10,071 **                218               14                      --
Oregon                         12,961                   312               19                     11.3
Pennsylvania                   47,926                   300               18                      5.7
Rhode Island                    6,644                   475 ***           29                     20.6
South Carolina                 11,611                   216               14                      6.9
South Dakota                    1,075                   100                7                     22.2
Tennessee                      17,250                   237               15                     15.7
Texas                          90,780                   282               21                      5.0
Utah                            3,945                   106                9                     10.6
Vermont                         2,580                   346               19                     29.2
Virginia                       28,285                   301               18                      5.9
Washington                     27,558                   350               23                      4.6
West Virginia                   2,619                   123                6                     11.8
Wisconsin                      14,671                   210               13                      4.5
Wyoming                           253                    39                2                     10.7

Total                        1,330,414                  334               22                      8.6
--------------------------------------------------------------------------------------------------------------------------------------
*   Abortion data reported by central health agencies unless otherwise specified.
+   Abortions per 1,000 live births (live-birth data reported by central health agencies unless otherwise specified).
&   Abortions per 1,000 women 15-44 years of age. The number of women in this age group was obtained from the U.S.
    Department of Commerce, Bureau of the Census (special unpublished tabulations).
@   Based on number of abortions for which residence of women was known.
**  Reported by hospitals and/or other medical facilities in state.
++  CDC estimate.
&&  >1,000 abortions per 1,000 live births.
@@  >100 abortions per 1,000 women aged 15-44 years.
*** Number of live births obtained from CDC's National Center for Health Statistics, Advance Report of Final Natality
    Statistics, 1993, vol. 44, no. 3, supplement, September 21, 1995.
+++ Percentage based on number reported as "Out-of-Reporting Area."
&&& Reported by the New York City Department of Health.
--  Not available.
======================================================================================================================================
Return to top. Table_4 Note: To print large tables and graphs users may have to change their printer settings to landscape and use a small font size.
TABLE 4. Reported number, * ratio, + and rate& of legal abortions and percentage of abortions obtained by
out-of-state residents, @ by state of occurrence -- United States, 1994
=================================================================================================================
                                                                             Percentage of legal abortions
                                                                               obtained by out-of-state
State               Total no. of legal abortions       Ratio         Rate              residents
-----------------------------------------------------------------------------------------------------------------
Alabama                        14,825                   244           15                  10.4
Alaska                          1,585 **                148           11                    --
Arizona                        13,930                   196           16                   3.5
Arkansas                        5,885                   169           11                   6.6
California                   308,564 ++                 544           43                    --
Colorado                        9,584                   177           11                   7.7
Connecticut                    14,757                   323           20                   3.9
Delaware                        5,637                   543           34                    --
Dist. of Columbia              16,437                    -- &&       -- @@                51.9
Florida                        73,394                   385           25                    --
Georgia                        36,374                   328           21                   9.5
Hawaii                          5,783                   298           22                   0.5
Idaho                           1,047                    60            4                   7.2
Illinois                       55,050                   291           21                    --
Indiana                        12,499                   151            9                   4.4
Iowa                            5,914 **                160           10                    --
Kansas                         10,468                   281           19                  40.6
Kentucky                        8,145                   154            9                  23.1
Louisiana                      12,154                   179           12                    --
Maine                           3,089                   215           11                   5.0
Maryland                       17,627                   238 ***       15                   6.6
Massachusetts                  32,195                   384           23                   4.3
Michigan                       33,061                   240           15                   3.8
Minnesota                      14,027                   218           13                   9.2
Mississippi                     3,979                    95            6                   4.1
Missouri                       11,879                   162           10                  10.6
Montana                         2,761                   250           15                  17.1
Nebraska                        5,324                   230           15                  20.2
Nevada                          6,736                   282           21                  11.3
New Hampshire                   3,008 **                199 ***       11                    --
New Jersey                     33,286                   283           19                   2.1
New Mexico                      4,929                   179           13                   4.9
New York                       49,598                   549           36                    --
  City+++                    103,900 &&&                839           --                   5.9
  State+++                     45,698                   307           --                   7.3
North Carolina                 35,088                   346           21                  10.8
North Dakota                    1,301                   152            9                  28.1
Ohio                           37,742                   242           15                   7.9
Oklahoma                        6,774 **                149           10                    --
Oregon                         13,392                   320           20                  11.6
Pennsylvania                   41,645                   266           16                   4.8
Rhode Island                    6,092                   452 ***       27                  20.5
South Carolina                 10,922                   210           13                   7.6
South Dakota                      987                    94            6                  20.3
Tennessee                      16,837                   230           14                  17.5
Texas                          89,185                   278           21                   5.0
Utah                            3,609                    94            8                  29.9
Vermont                         2,321                   314           17                  25.3
Virginia                       26,369                   279           17                   6.3
Washington                     25,965                   336           21                   5.0
West Virginia                   2,085                    98            5                  12.9
Wisconsin                      13,396                   196           12                   4.5
Wyoming                           174                    27            2                   6.3
Total                       1,267,415                   321           21                   8.5
-----------------------------------------------------------------------------------------------------------------
*   Abortion data reported by central health agencies unless otherwise specified.
+   Abortions per 1,000 live births (live-birth data reported by central health agencies unless otherwise
    specified).
&   Abortions per 1,000 women 15-44 years of age. The number of women in this age group was obtained from the
    U.S. Department of Commerce, Bureau of the Census (special unpublished tabulations).
@   Based on number of abortions for which residence of women was known.
**  Reported by hospitals and/or other medical facilities in state.
++  CDC estimate.
&&  >1,000 abortions per 1,000 live births.
@@  >100 abortions per 1,000 women ages 15-44 years.
*** Number of live births obtained from CDC's National Center for Health Statistics, Advance Report of Final
    Natality Statistics, 1994, vol. 44, no. 11, supplement, June 24, 1996.
+++ Percentage based on the number reported as "Out-of-Reporting Area."
&&& Reported by the New York City Department of Health.
--  Not available.
=================================================================================================================
Return to top. Table_5 Note: To print large tables and graphs users may have to change their printer settings to landscape and use a small font size.
TABLE 5. Reported legal abortions, by age of women who obtained an abortion and state of occurrence -- selected states,* United States, 1993
=======================================================================================================================================================================================================
Age group (yrs)
-------------------------------------------------------------------------------------------------------------------------------------------
<15 15-19 20-24 25-29 30-34 35-39 >=40 Unknown Total +
----------- ------------ ------------- -------------- ---------------- ------------ ------------- -------------- -------------------
State No. % No. % No. % No. % No. % No. % No. % No. % No. %
-------------------------------------------------------------------------------------------------------------------------------------------------------------------------------------------------------
Alabama 212 1.5 3,183 22.0 5,279 36.4 2,771 19.1 1,749 12.1 1,003 6.9 275 1.9 22 0.2 14,494 100.0
Arizona 82 0.6 2,594 19.0 4,576 33.5 2,883 21.1 1,910 14.0 1,026 7.5 249 1.8 328 2.4 13,648 100.0
Arkansas 53 0.9 1,225 21.9 2,140 38.3 1,082 19.4 633 11.3 333 6.0 91 1.6 25 0.4 5,582 100.0
Colorado 84 0.8 2,225 22.0 3,223 31.9 2,016 19.9 1,424 14.1 863 8.5 266 2.6 14 0.1 10,115 100.0
Connecticut 146 0.9 3,454 20.7 5,829 34.9 3,650 21.9 2,118 12.7 1,093 6.5 320 1.9 80 0.5 16,690 100.0
Dist. of Columbia & 51 0.6 1,464 18.6 2,645 33.6 1,826 23.2 1,070 13.6 623 7.9 174 2.2 12 0.2 7,865 100.0
Georgia 452 1.2 7,164 18.9 13,132 34.7 8,447 22.3 5,112 13.5 2,629 7.0 692 1.8 191 0.5 37,819 100.0
Hawaii 44 0.8 1,238 21.2 1,835 31.4 1,259 21.6 862 14.8 451 7.7 142 2.4 4 0.1 5,835 100.0
Idaho 12 0.9 289 21.5 461 34.2 243 18.1 190 14.1 122 9.1 29 2.2 0 0.0 1,346 100.0
Indiana 103 0.9 2,280 20.1 4,158 36.7 2,350 20.7 1,432 12.6 763 6.7 218 1.9 26 0.2 11,330 100.0
Kansas 133 1.2 2,665 24.3 3,724 33.9 2,093 19.1 1,320 12.0 782 7.1 205 1.9 55 0.5 10,977 100.0
Kentucky 93 1.1 2,157 25.5 2,967 35.1 1,565 18.5 1,001 11.8 490 5.8 131 1.5 49 0.6 8,453 100.0
Louisiana 157 1.3 2,487 20.1 4,300 34.8 2,543 20.6 1,667 13.5 917 7.4 274 2.2 28 0.2 12,373 100.0
Maine 23 0.7 669 20.3 1,109 33.6 665 20.1 469 14.2 251 7.6 76 2.3 39 1.2 3,301 100.0
Maryland 221 1.1 3,608 18.7 6,592 34.1 4,520 23.4 2,763 14.3 1,311 6.8 303 1.6 0 0.0 19,318 100.0
Massachusetts 215 0.6 5,872 16.6 11,225 31.8 8,096 22.9 5,389 15.3 2,798 7.9 949 2.7 768 2.2 35,312 100.0
Michigan 292 0.8 7,264 20.3 12,799 35.8 7,373 20.6 4,703 13.2 2,552 7.1 694 1.9 60 0.2 35,737 100.0
Minnesota 101 0.7 2,592 18.1 4,915 34.3 3,021 21.1 2,088 14.6 1,119 7.8 327 2.3 187 1.3 14,350 100.0
Mississippi 103 1.7 1,414 23.6 2,195 36.6 1,120 18.7 723 12.0 338 5.6 84 1.4 25 0.4 6,002 100.0
Missouri 149 1.2 2,335 18.6 4,304 34.3 2,732 21.8 1,725 13.8 998 8.0 294 2.3 3 0.0 12,540 100.0
Montana 21 0.8 653 24.7 838 31.7 476 18.0 360 13.6 211 8.0 85 3.2 1 0.0 2,645 100.0
Nebraska 36 0.7 1,191 21.7 1,969 35.9 1,081 19.7 706 12.9 384 7.0 115 2.1 4 0.1 5,486 100.0
Nevada 49 0.7 1,080 15.5 2,130 30.6 1,736 25.0 1,106 15.9 630 9.1 177 2.5 47 0.7 6,955 100.0
New Jersey 294 0.8 6,632 18.2 12,676 34.7 8,325 22.8 5,023 13.8 2,703 7.4 807 2.2 48 0.1 36,508 100.0
New Mexico 37 0.7 1,112 20.7 1,749 32.5 1,086 20.2 791 14.7 415 7.7 166 3.1 25 0.5 5,381 100.0
New York 1,140 0.7 28,169 17.8 49,926 31.6 37,858 24.0 24,043 15.2 12,228 7.7 3,463 2.2 1,064 0.7 157,891 100.0
City 866 0.8 18,597 16.8 33,883 30.7 27,627 25.0 17,763 16.1 8,850 8.0 2,477 2.2 372 0.3 110,435 100.0
State 274 0.6 9,572 20.2 16,043 33.8 10,231 21.6 6,280 13.2 3,378 7.1 986 2.1 692 1.5 47,456 100.0
North Carolina 301 0.9 7,729 22.1 12,561 36.0 7,043 20.2 4,054 11.6 2,107 6.0 596 1.7 515 1.5 34,906 100.0
North Dakota 5 0.4 359 25.5 503 35.8 252 17.9 163 11.6 95 6.8 29 2.1 0 0.0 1,406 100.0
Ohio 254 0.6 6,540 15.7 14,938 35.8 8,481 20.4 5,137 12.3 2,925 7.0 871 2.1 2,527 6.1 41,673 100.0
Oregon 94 0.7 2,800 21.6 4,230 32.6 2,677 20.7 1,608 12.4 965 7.4 304 2.3 283 2.2 12,961 100.0
Pennsylvania 499 1.0 9,645 20.1 16,554 34.5 10,156 21.2 6,493 13.5 3,605 7.5 973 2.0 1 0.0 47,926 100.0
Rhode Island 38 0.6 1,196 18.0 2,362 35.6 1,423 21.4 936 14.1 539 8.1 150 2.3 0 0.0 6,644 100.0
South Carolina 137 1.2 2,288 19.7 4,196 36.1 2,458 21.2 1,510 13.0 830 7.1 192 1.7 0 0.0 11,611 100.0
South Dakota 9 0.8 271 25.2 345 32.1 185 17.2 148 13.8 86 8.0 31 2.9 0 0.0 1,075 100.0
Tennessee 190 1.1 3,567 20.7 6,148 35.6 3,546 20.6 2,258 13.1 1,186 6.9 316 1.8 39 0.2 17,250 100.0
Texas 449 0.5 15,655 17.2 32,264 35.5 20,452 22.5 12,846 14.2 6,811 7.5 2,093 2.3 210 0.2 90,780 100.0
Utah 34 0.9 781 19.8 1,344 34.1 856 21.7 525 13.3 296 7.5 82 2.1 27 0.7 3,945 100.0
Vermont 12 0.5 534 20.7 944 36.6 493 19.1 358 13.9 170 6.6 66 2.6 3 0.1 2,580 100.0
Virginia 222 0.8 5,296 18.7 9,489 33.5 6,492 23.0 4,028 14.2 2,154 7.6 560 2.0 44 0.2 28,285 100.0
Washington 164 0.6 5,555 20.2 9,045 32.8 5,824 21.1 3,901 14.2 2,244 8.1 722 2.6 103 0.4 27,558 100.0
West Virginia 22 0.8 636 24.3 951 36.3 477 18.2 314 12.0 171 6.5 47 1.8 1 0.0 2,619 100.0
Wisconsin & 123 0.9 2,724 19.5 5,055 36.1 2,976 21.3 1,829 13.1 1,006 7.2 291 2.1 0 0.0 14,004 100.0
Wyoming 2 0.8 73 28.9 66 26.1 47 18.6 39 15.4 21 8.3 4 1.6 1 0.4 253 100.0
Total 6,858 0.8 160,665 19.0 287,691 34.1 184,655 21.9 116,524 13.8 62,244 7.4 17,933 2.1 6,859 0.8 843,429 100.0
Abortion ratio @ 744 440 384 227 180 248 430 291
Abortion rate ** 3 25 42 26 14 8 2 18
-------------------------------------------------------------------------------------------------------------------------------------------------------------------------------------------------------
* Data from 42 states, the District of Columbia, and New York City.
+ Percentages may not add to 100.0 due to rounding.
& Includes residents only.
@ Calculated as the number of legal abortions obtained by women in a given age group per 1,000 live births to women in the same age group for these
states. For each state, data for women of unknown age were distributed according
to the known age distribution for that state.
** Calculated as the number of legal abortions obtained by women in a given age group per 1,000 women of the same age group for these states. For
each state, data for women of unknown age were distributed according to the
known age distribution for that state.
=======================================================================================================================================================================================================
Return to top. Table_6 Note: To print large tables and graphs users may have to change their printer settings to landscape and use a small font size.
TABLE 6. Reported legal abortions, by age of women who obtained an abortion and state of occurrence -- selected states, * United States, 1994
=====================================================================================================================================================================================================================================================
Age group (yrs)
----------------------------------------------------------------------------------------------------------------------------------------------------------------------------------------------
<15 15-19 20-24 25-29 30-34 35-39 >=40 Unknown Total +
---------- ------------- -------------- ------------ ------------- ------------ --------------- ------------- ---------------
State No. % No. % No. % No. % No. % No. % No. % No. % No. %
------------------------------------------------------------------------------------------------------------------------------------------------------------------------------------------------------------------------------------------------------
Alabama 210 1.4 3,213 21.7 5,454 36.8 2,873 19.4 1,770 11.9 984 6.6 284 1.9 37 0.2 14,825 100.0
Arizona 91 0.7 2,671 19.2 4,410 31.7 2,928 21.0 1,971 14.1 1,082 7.8 279 2.0 498 3.6 13,930 100.0
Arkansas 74 1.3 1,374 23.3 2,188 37.2 1,096 18.6 666 11.3 367 6.2 94 1.6 26 0.4 5,885 100.0
Colorado 91 0.9 2,131 22.2 3,049 31.8 1,819 19.0 1,406 14.7 811 8.5 249 2.6 28 0.3 9,584 100.0
Connecticut 92 0.6 3,004 20.4 4,909 33.3 3,304 22.4 1,974 13.4 1,054 7.1 291 2.0 129 0.9 14,757 100.0
Dist. of Columbia & 105 1.4 1,507 19.4 2,734 35.2 1,805 23.3 1,050 13.5 446 5.7 108 1.4 6 0.1 7,761 100.0
Georgia 479 1.3 6,728 18.5 12,464 34.3 8,086 22.2 5,119 14.1 2,564 7.0 735 2.0 199 0.5 36,374 100.0
Hawaii 43 0.7 1,301 22.5 1,763 30.5 1,220 21.1 784 13.6 502 8.7 166 2.9 4 0.1 5,783 100.0
Idaho 4 0.4 256 24.5 327 31.2 208 19.9 138 13.2 82 7.8 31 3.0 1 0.1 1,047 100.0
Indiana 130 1.0 2,584 20.7 4,520 36.2 2,505 20.0 1,585 12.7 895 7.2 247 2.0 33 0.3 12,499 100.0
Kansas 110 1.1 2,534 24.2 3,498 33.4 1,916 18.3 1,353 12.9 790 7.5 223 2.1 44 0.4 10,468 100.0
Kentucky 108 1.3 2,031 24.9 2,820 34.6 1,542 18.9 952 11.7 511 6.3 137 1.7 44 0.5 8,145 100.0
Louisiana 169 1.4 2,500 20.6 4,215 34.7 2,505 20.6 1,517 12.5 929 7.6 274 2.3 45 0.4 12,154 100.0
Maine 21 0.7 623 20.2 995 32.2 634 20.5 439 14.2 258 8.4 84 2.7 35 1.1 3,089 100.0
Maryland 194 1.1 3,395 19.3 5,846 33.2 4,058 23.0 2,544 14.4 1,238 7.0 352 2.0 0 0.0 17,627 100.0
Massachusetts 177 0.5 5,181 16.1 9,984 31.0 7,465 23.2 4,949 15.4 2,789 8.7 900 2.8 750 2.3 32,195 100.0
Michigan 271 0.8 6,839 20.7 11,626 35.2 6,892 20.8 4,314 13.0 2,376 7.2 659 2.0 84 0.3 33,061 100.0
Minnesota 103 0.7 2,510 17.9 4,645 33.1 3,059 21.8 2,029 14.5 1,187 8.5 353 2.5 141 1.0 14,027 100.0
Mississippi 60 1.5 807 20.3 1,514 38.0 757 19.0 477 12.0 269 6.8 93 2.3 2 0.1 3,979 100.0
Missouri 142 1.2 2,341 19.7 3,909 32.9 2,511 21.1 1,713 14.4 964 8.1 289 2.4 10 0.1 11,879 100.0
Montana 24 0.9 681 24.7 841 30.5 479 17.3 395 14.3 255 9.2 86 3.1 0 0.0 2,761 100.0
Nebraska 34 0.6 1,144 21.5 1,877 35.3 1,051 19.7 701 13.2 396 7.4 117 2.2 4 0.1 5,324 100.0
Nevada 55 0.8 1,068 15.9 1,971 29.3 1,561 23.2 1,213 18.0 653 9.7 183 2.7 32 0.5 6,736 100.0
New Jersey 249 0.7 5,958 17.9 11,297 33.9 7,708 23.2 4,714 14.2 2,528 7.6 783 2.4 49 0.1 33,286 100.0
New Mexico 34 0.7 992 20.1 1,507 30.6 1,030 20.9 735 14.9 429 8.7 172 3.5 30 0.6 4,929 100.0
New York 1,096 0.7 27,436 18.3 46,052 30.8 35,655 23.8 23,283 15.6 12,074 8.1 3,590 2.4 412 0.3 149,598 100.0
City 821 0.8 17,804 17.1 31,090 29.9 25,850 24.9 16,938 16.3 8,624 8.3 2,485 2.4 288 0.3 103,900 100.0
State 275 0.6 9,632 21.1 14,962 32.7 9,805 21.5 6,345 13.9 3,450 7.5 1,105 2.4 124 0.3 45,698 100.0
North Carolina 359 1.0 7,694 21.9 12,376 35.3 6,849 19.5 4,298 12.2 2,221 6.3 613 1.7 678 1.9 35,088 100.0
North Dakota 5 0.4 318 24.4 479 36.8 244 18.8 139 10.7 79 6.1 34 2.6 3 0.2 1,301 100.0
Ohio 254 0.7 6,713 17.8 13,628 36.1 8,172 21.7 4,834 12.8 2,936 7.8 874 2.3 331 0.9 37,742 100.0
Oregon 71 0.5 2,865 21.4 4,256 31.8 2,806 21.0 1,855 13.9 1,016 7.6 333 2.5 190 1.4 13,392 100.0
Pennsylvania 432 1.0 7,906 19.0 13,985 33.6 9,028 21.7 5,791 13.9 3,514 8.4 989 2.4 0 0.0 41,645 100.0
Rhode Island 42 0.7 1,106 18.2 2,085 34.2 1,326 21.8 895 14.7 491 8.1 146 2.4 1 0.0 6,092 100.0
South Carolina 106 1.0 2,251 20.6 3,870 35.4 2,262 20.7 1,454 13.3 770 7.0 209 1.9 0 0.0 10,922 100.0
South Dakota 5 0.5 255 25.8 300 30.4 178 18.0 143 14.5 81 8.2 25 2.5 0 0.0 987 100.0
Tennessee 189 1.1 3,480 20.7 5,948 35.3 3,385 20.1 2,259 13.4 1,206 7.2 364 2.2 6 0.0 16,837 100.0
Texas 434 0.5 15,471 17.3 30,890 34.6 20,389 22.9 12,570 14.1 6,957 7.8 2,255 2.5 219 0.2 89,185 100.0
Utah 24 0.7 695 19.3 1,170 32.4 794 22.0 533 14.8 291 8.1 88 2.4 14 0.4 3,609 100.0
Vermont 11 0.5 517 22.3 751 32.4 462 19.9 294 12.7 219 9.4 65 2.8 2 0.1 2,321 100.0
Virginia 234 0.9 5,122 19.4 8,488 32.2 5,878 22.3 3,876 14.7 2,118 8.0 610 2.3 43 0.2 26,369 100.0
Washington 192 0.7 5,172 19.9 8,054 31.0 5,574 21.5 3,794 14.6 2,231 8.6 724 2.8 224 0.9 25,965 100.0
West Virginia 29 1.4 545 26.1 704 33.8 378 18.1 242 11.6 135 6.5 50 2.4 2 0.1 2,085 100.0
Wisconsin & 103 0.8 2,485 19.4 4,418 34.5 2,731 21.4 1,806 14.1 957 7.5 290 2.3 0 0.0 12,790 100.0
Wyoming 5 2.9 37 21.3 52 29.9 26 14.9 29 16.7 16 9.2 9 5.2 0 0.0 174 100.0
Total 6,661 0.8 153,441 19.2 265,869 33.3 175,149 21.9 112,603 14.1 61,671 7.7 18,457 2.3 4,356 0.5 798,207 100.0
Abortion ratio @ 704 415 364 222 172 234 412 277
Abortion rate ** 2 24 39 25 14 7 2 17
-----------------------------------------------------------------------------------------------------------------------------------------------------------------------------------------------------------------------------------------------------
* Data from 42 states, the District of Columbia, and New York City.
+ Percentages may not add to 100.0 due to rounding.
& Includes residents only.
@ Calculated as the number of legal abortions obtained by women in a given age group per 1,000 live births to women in the same age group for these
states. For each state, data for women of unknown age were distributed according to the known age distribution for that state.
** Calculated as the number of legal abortions obtained by women in a given age group per 1,000 women in the same age group for these states. For
each state, data for women of unknown age were distributed according to the known age distribution for that state.
=====================================================================================================================================================================================================================================================
Return to top. Table_7 Note: To print large tables and graphs users may have to change their printer settings to landscape and use a small font size.
TABLE 7.  Reported legal abortions obtained by adolescents, by known age and state of occurrence -- selected states,* United States, 1993
==============================================================================================================================================
                                                                         Age (yrs)
                       ---------------------------------------------------------------------------------------------------
                             <15                15             16               17              18               19            Total +
                       ----------------     -----------   --------------    -----------    -------------    -------------    -----------------
State                   No.           %      No.     %      No.       %      No.      %      No.       %      No.      %        No.       %
----------------------------------------------------------------------------------------------------------------------------------------------
Alabama                 212         6.2      259   7.6      436    12.8      502   14.8      913    26.9    1,073   31.6      3,395   100.0
Arizona                  82         3.1      166   6.2      356    13.3      475   17.8      795    29.7      802   30.0      2,676   100.0
Arkansas                 53         4.1       76   5.9      147    11.5      211   16.5      393    30.8      398   31.1      1,278   100.0
Colorado                 84         3.6      183   7.9      328    14.2      488   21.1      595    25.8      631   27.3      2,309   100.0
Connecticut             146         4.1      251   7.0      504    14.0      770   21.4      912    25.3    1,017   28.3      3,600   100.0
Georgia                 452         5.9      623   8.2    1,021    13.4    1,232   16.2    2,010    26.4    2,278   29.9      7,616   100.0
Hawaii                   44         3.4       82   6.4      178    13.9      274   21.4      331    25.8      373   29.1      1,282   100.0
Idaho                    12         4.0       26   8.6       47    15.6       33   11.0       93    30.9       90   29.9        301   100.0
Indiana                 103         4.3      175   7.3      273    11.5      330   13.8      699    29.3      803   33.7      2,383   100.0
Kansas                  133         4.8      233   8.3      389    13.9      545   19.5      738    26.4      760   27.2      2,798   100.0
Kentucky                 93         4.1      183   8.1      362    16.1      483   21.5      553    24.6      576   25.6      2,250   100.0
Louisiana               157         5.9      238   9.0      333    12.6      361   13.7      789    29.8      766   29.0      2,644   100.0
Maine                    23         3.3       54   7.8       76    11.0      143   20.7      180    26.0      216   31.2        692   100.0
Maryland                221         5.8      319   8.3      530    13.8      731   19.1      915    23.9    1,113   29.1      3,829   100.0
Massachusetts           215         3.5      337   5.5      576     9.5      857   14.1    1,863    30.6    2,239   36.8      6,087   100.0
Michigan                292         3.9      588   7.8      955    12.6    1,267   16.8    2,117    28.0    2,337   30.9      7,556   100.0
Minnesota               101         3.8      169   6.3      320    11.9      413   15.3      777    28.9      913   33.9      2,693   100.0
Mississippi             103         6.8      105   6.9      177    11.7      234   15.4      429    28.3      469   30.9      1,517   100.0
Missouri                149         6.0      200   8.1      325    13.1      328   13.2      717    28.9      765   30.8      2,484   100.0
Montana                  21         3.1       50   7.4       87    12.9      140   20.8      191    28.3      185   27.4        674   100.0
Nebraska                 36         2.9       65   5.3      139    11.3      187   15.2      384    31.3      416   33.9      1,227   100.0
Nevada                   49         4.3       73   6.5      153    13.6      237   21.0      302    26.7      315   27.9      1,129   100.0
New Jersey              294         4.2      483   7.0      913    13.2    1,309   18.9    1,793    25.9    2,134   30.8      6,926   100.0
New Mexico               37         3.2       70   6.1      171    14.9      202   17.6      348    30.3      321   27.9      1,149   100.0
New York              1,140         3.9    2,081   7.1    4,032    13.8    5,739   19.6    7,671    26.2    8,646   29.5     29,309   100.0
  City                  866         4.4    1,485   7.6    2,772    14.2    3,706   19.0    4,961    25.5    5,673   29.1     19,463   100.0
  State                 274         2.8      596   6.1    1,260    12.8    2,033   20.6    2,710    27.5    2,973   30.2      9,846   100.0
North Carolina          301         3.7      607   7.6    1,124    14.0    1,454   18.1    2,140    26.7    2,404   29.9      8,030   100.0
North Dakota              5         1.4       18   4.9       39    10.7       59   16.2      122    33.5      121   33.2        364   100.0
Ohio                    254         3.7      422   6.2      832    12.2    1,085   16.0    1,732    25.5    2,469   36.3      6,794   100.0
Oregon                   94         3.2      178   6.2      402    13.9      576   19.9      778    26.9      866   29.9      2,894   100.0
Pennsylvania            499         4.9      738   7.3    1,258    12.4    1,990   19.6    2,674    26.4    2,985   29.4     10,144   100.0
Rhode Island             38         3.1       63   5.1      130    10.5      155   12.6      385    31.2      463   37.5      1,234   100.0
South Carolina          137         5.6      174   7.2      254    10.5      437   18.0      671    27.7      752   31.0      2,425   100.0
South Dakota              9         3.2       20   7.1       49    17.5       53   18.9       68    24.3       81   28.9        280   100.0
Tennessee               190         5.1      271   7.2      455    12.1      600   16.0    1,072    28.5    1,169   31.1      3,757   100.0
Texas                   449         2.8      887   5.5    1,788    11.1    2,772   17.2    4,414    27.4    5,794   36.0     16,104   100.0
Utah                     34         4.2       50   6.1       97    11.9      138   16.9      222    27.2      274   33.6        815   100.0
Vermont                  12         2.2       42   7.7       78    14.3      102   18.7      140    25.6      172   31.5        546   100.0
Virginia                222         4.0      356   6.5      699    12.7      988   17.9    1,668    30.2    1,585   28.7      5,518   100.0
Washington              164         2.9      413   7.2      823    14.4    1,142   20.0    1,535    26.8    1,642   28.7      5,719   100.0
West Virginia            22         3.3       46   7.0       92    14.0      100   15.2      180    27.4      218   33.1        658   100.0
Wisconsin&              123         4.3      183   6.4      341    12.0      490   17.2      799    28.1      911   32.0      2,847   100.0
Wyoming                   2         2.7        4   5.3       11    14.7       13   17.3       22    29.3       23   30.7         75   100.0
Total                 6,807         4.1   11,561   7.0   21,300    12.8   29,645   17.9   45,130    27.2   51,565   31.1    166,008   100.0
Abortion ratio @        745                  536            478              415             449              413               446
Abortion rate **          3                    9             17               24              36               40                18
----------------------------------------------------------------------------------------------------------------------------------------------
*  Data from 42 states and New York City.
+  Percentages may not add to 100.0 due to rounding.
&  Includes residents only.
@  Calculated as the number of legal abortions obtained by women of a given age per 1,000 live births to women of the same age for these
   states. For each state, data for women of unknown age were distributed according to the known age distribution for that state.
** Calculated as the number of legal abortions obtained by women of a given age per 1,000 women of the same age for these states. For each
   state, data for women of unknown age were distributed according to the known age distribution for that state.
==============================================================================================================================================
Return to top. Table_8 Note: To print large tables and graphs users may have to change their printer settings to landscape and use a small font size.
TABLE 8.  Reported legal abortions obtained by adolescents, by known age and state of occurrence -- selected states,* United States, 1994
===================================================================================================================================================
                                                                           Age (yrs)
                            --------------------------------------------------------------------------------------------------
                                <15                15               16               17              18               19             Total +
                            -------------     ------------    --------------   ------------    --------------   ------------     ------------------
State                        No.        %      No.       %      No.       %      No.      %      No.       %      No.      %        No.       %
---------------------------------------------------------------------------------------------------------------------------------------------------
Alabama                      210      6.1      267     7.8      401    11.7      522   15.2      933    27.3    1,090   31.8      3,423   100.0
Arizona                       91      3.3      178     6.4      354    12.8      512   18.5      782    28.3      845   30.6      2,762   100.0
Arkansas                      74      5.1      102     7.0      166    11.5      238   16.4      425    29.4      443   30.6      1,448   100.0
Colorado                      91      4.1      176     7.9      345    15.5      455   20.5      553    24.9      602   27.1      2,222   100.0
Connecticut                   92      3.0      237     7.7      423    13.7      701   22.6      773    25.0      870   28.1      3,096   100.0
Georgia                      479      6.6      620     8.6      951    13.2    1,247   17.3    1,824    25.3    2,086   28.9      7,207   100.0
Hawaii                        43      3.2      109     8.1      187    13.9      279   20.8      349    26.0      377   28.1      1,344   100.0
Idaho                          4      1.5       23     8.8       32    12.3       42   16.2       83    31.9       76   29.2        260   100.0
Indiana                      130      4.8      232     8.5      290    10.7      369   13.6      781    28.8      912   33.6      2,714   100.0
Kansas                       110      4.2      221     8.4      400    15.1      516   19.5      691    26.1      706   26.7      2,644   100.0
Kentucky                     108      5.0      184     8.6      303    14.2      413   19.3      548    25.6      583   27.3      2,139   100.0
Louisiana                    169      6.3      207     7.8      326    12.2      394   14.8      779    29.2      794   29.7      2,669   100.0
Maine                         21      3.3       29     4.5       97    15.1      118   18.3      180    28.0      199   30.9        644   100.0
Maryland                     194      5.4      333     9.3      460    12.8      668   18.6      905    25.2    1,029   28.7      3,589   100.0
Massachusetts                177      3.3      313     5.8      556    10.4      835   15.6    1,572    29.3    1,904   35.5      5,357   100.0
Michigan                     271      3.8      511     7.2      881    12.4    1,257   17.7    2,013    28.3    2,177   30.6      7,110   100.0
Minnesota                    103      3.9      158     6.0      317    12.1      416   15.9      757    29.0      862   33.0      2,613   100.0
Mississippi                   60      6.9       63     7.3      106    12.2      120   13.8      236    27.2      282   32.5        867   100.0
Missouri                     142      5.7      180     7.2      320    12.9      361   14.5      663    26.7      817   32.9      2,483   100.0
Montana                       24      3.4       42     6.0       91    12.9      153   21.7      209    29.6      186   26.4        705   100.0
Nebraska                      34      2.9       74     6.3      118    10.0      216   18.3      389    33.0      347   29.5      1,178   100.0
Nevada                        55      4.9       91     8.1      156    13.9      217   19.3      295    26.3      309   27.5      1,123   100.0
New Jersey                   249      4.0      444     7.2      749    12.1    1,190   19.2    1,665    26.8    1,910   30.8      6,207   100.0
New Mexico                    34      3.3       80     7.8      152    14.8      197   19.2      292    28.5      271   26.4      1,026   100.0
New York                   1,096      3.8    1,999     7.0    3,887    13.6    5,804   20.3    7,388    25.9    8,358   29.3     28,532   100.0
  City                       821      4.4    1,356     7.3    2,575    13.8    3,784   20.3    4,694    25.2    5,395   29.0     18,625   100.0
  State                      275      2.8      643     6.5    1,312    13.2    2,020   20.4    2,694    27.2    2,963   29.9      9,907   100.0
North Carolina               359      4.5      617     7.7    1,109    13.8    1,607   20.0    2,083    25.9    2,278   28.3      8,053   100.0
North Dakota                   5      1.5       19     5.9       36    11.1       57   17.6      109    33.7       97   30.0        323   100.0
Ohio                         254      3.6      489     7.0      853    12.2    1,212   17.4    1,775    25.5    2,384   34.2      6,967   100.0
Oregon                        71      2.4      236     8.0      409    13.9      609   20.7      777    26.5      834   28.4      2,936   100.0
Pennsylvania                 432      5.2      731     8.8    1,058    12.7    1,259   15.1    2,336    28.0    2,522   30.2      8,338   100.0
Rhode Island                  42      3.7       80     7.0      123    10.7      146   12.7      358    31.2      399   34.8      1,148   100.0
South Carolina               106      4.5      198     8.4      278    11.8      494   21.0      589    25.0      692   29.4      2,357   100.0
South Dakota                   5      1.9       29    11.2       33    12.7       54   20.8       70    26.9       69   26.5        260   100.0
Tennessee                    189      5.2      293     8.0      446    12.2      605   16.5    1,016    27.7    1,120   30.5      3,669   100.0
Texas                        434      2.7      977     6.1    1,849    11.6    2,891   18.2    4,294    27.0    5,460   34.3     15,905   100.0
Utah                          24      3.3       47     6.5      107    14.9      118   16.4      208    28.9      215   29.9        719   100.0
Vermont                       11      2.1       41     7.8       64    12.1      104   19.7      153    29.0      155   29.4        528   100.0
Virginia                     234      4.4      375     7.0      670    12.5      933   17.4    1,527    28.5    1,617   30.2      5,356   100.0
Washington                   192      3.6      424     7.9      785    14.6    1,105   20.6    1,410    26.3    1,448   27.0      5,364   100.0
West Virginia                 29      5.1       46     8.0       87    15.2      123   21.4      139    24.2      150   26.1        574   100.0
Wisconsin &                  103      4.0      166     6.4      341    13.2      431   16.7      707    27.3      840   32.5      2,588   100.0
Wyoming                        5     11.9        6    14.3        4     9.5        6   14.3       10    23.8       11   26.2         42   100.0

Total                      6,556      4.1   11,647     7.3   20,320    12.8   28,994   18.3   42,646    26.9   48,326   30.5    158,489   100.0

Abortion ratio @             700               523              446              392             426              383               420
Abortion rate **               2                 9               16               22              34               36                17
---------------------------------------------------------------------------------------------------------------------------------------------------
*  Data from 42 states and New York City.
+  Percentages may not add to 100.0 due to rounding.
&  Includes residents only.
@  Calculated as the number of legal abortions obtained by women of a given age per 1,000 live births to women of the same age for these states.
   or each state, data for women of unknown age were distributed according to the known age distribution for that state.
** Calculated as the number of legal abortions obtained by women of a given age per 1,000 women of the same age for these states. For each state,
   data for women of unknown age were distributed according to the known age distribution for that state.
===================================================================================================================================================
Return to top. Table_9 Note: To print large tables and graphs users may have to change their printer settings to landscape and use a small font size.
TABLE 9. Reported legal abortions, by weeks of gestation* and state of occurrence -- selected states,+ United States, 1993
==============================================================================================================================================================================================================
Weeks of gestation
---------------------------------------------------------------------------------------------------------------------------------------------
<=8 9-10 11-12 13-15 16-20 >=21 Unknown Total &
--------------------------- ------------- -------------- -------------- ------------ ------------- -------------- ---------------------
State No. % No. % No. % No. % No. % No. % No. % No. %
--------------------------------------------------------------------------------------------------------------------------------------------------------------------------------------------------------------
Alabama 7,609 52.5 3,359 23.2 1,660 11.5 1,022 7.1 527 3.6 182 1.3 135 0.9 14,494 100.0
Arizona @ 6,878 50.4 3,051 22.4 1,096 8.0 598 4.4 211 1.5 12 0.1 1,802 13.2 13,648 100.0
Arkansas 3,179 57.0 1,294 23.2 533 9.5 292 5.2 165 3.0 13 0.2 106 1.9 5,582 100.0
Colorado 2,701 26.7 3,650 36.1 1,741 17.2 912 9.0 464 4.6 189 1.9 458 4.5 10,115 100.0
Connecticut@ 8,928 ** 53.5 4,156 ** 24.9 1,976 ** 11.8 1,194 7.2 281 1.7 13 0.1 142 0.9 16,690 100.0
Dist. of Columbia ++ 3,345 42.5 2,139 27.2 1,319 16.8 822 10.5 202 && 2.6 26@@ 0.3 12 0.2 7,865 100.0
Georgia 13,807 36.5 10,314 27.3 6,287 16.6 2,866 7.6 1,635 4.3 773 2.0 2,137 5.7 37,819 100.0
Hawaii @ 2,777 47.6 1,530 26.2 687 11.8 351 6.0 344 5.9 63 1.1 83 1.4 5,835 100.0
Idaho 673 50.0 404 30.0 203 15.1 52 3.9 8 0.6 2 0.1 4 0.3 1,346 100.0
Indiana 8,147 71.9 2,007 17.7 778 6.9 201 1.8 122 1.1 1 0.0 74 0.7 11,330 100.0
Kansas@ 5,205 47.4 1,924 17.5 1,019 9.3 722 6.6 759 6.9 950 8.7 398 3.6 10,977 100.0
Kentucky 4,146 49.0 1,803 21.3 1,036 12.3 586 6.9 487 5.8 194 2.3 201 2.4 8,453 100.0
Louisiana 5,447 44.0 3,582 29.0 1,541 12.5 909 7.3 574 4.6 206 1.7 114 0.9 12,373 100.0
Maine 1,580 47.9 1,051 31.8 499 15.1 102 3.1 27 0.8 5 0.2 37 1.1 3,301 100.0
Maryland @ 9,784 50.6 5,171 26.8 2,451 12.7 1,196 6.2 613 3.2 5 0.0 98 0.5 19,318 100.0
Michigan 21,092 59.0 7,028 19.7 3,430 9.6 2,650 7.4 1,363 3.8 166 0.5 8 0.0 35,737 100.0
Minnesota 8,598 59.9 2,442 17.0 1,452 10.1 896 6.2 599 4.2 106 0.7 257 1.8 14,350 100.0
Mississippi 2,705 45.1 1,454 24.2 763 12.7 573 9.5 386 6.4 70 1.2 51 0.8 6,002 100.0
Missouri 4,534 36.2 4,130 32.9 2,409 19.2 986 7.9 408 3.3 68 0.5 5 0.0 12,540 100.0
Montana@ 1,522 57.5 570 21.6 318 12.0 125 4.7 90 3.4 17 0.6 3 0.1 2,645 100.0
Nevada 4,144 59.6 1,350 19.4 752 10.8 364 5.2 261 3.8 2 0.0 82 1.2 6,955 100.0
New Jersey 18,549 50.8 6,904 18.9 2,586 7.1 3,209 8.8 2,723 7.5 436 1.2 2,101 5.8 36,508 100.0
New Mexico 2,690 50.0 949 17.6 485 9.0 336 6.2 305 5.7 39 0.7 577 10.7 5,381 100.0
New York 82,307 52.1 34,362 21.8 15,868 10.0 8,522 5.4 8,213 5.2 3,341 2.1 5,278 3.3 157,891 100.0
City 58,836 53.3 23,149 21.0 10,722 9.7 6,170 5.6 7,226 6.5 3,073 2.8 1,259 1.1 110,435 100.0
State 23,471 49.5 11,213 23.6 5,146 10.8 2,352 5.0 987 2.1 268 0.6 4,019 8.5 47,456 100.0
North Carolina 17,608 50.4 8,332 23.9 4,285 12.3 2,547 7.3 784 2.2 75 0.2 1,275 3.7 34,906 100.0
North Dakota @ 780 55.5 357 25.4 153 10.9 95 6.8 14 1.0 0 0.0 7 0.5 1,406 100.0
Oregon 6,359 49.1 3,295 25.4 1,249 9.6 606 4.7 494 3.8 213 1.6 745 5.7 12,961 100.0
Pennsylvania 23,111 48.2 13,569 28.3 5,957 12.4 2,956 6.2 2,005 4.2 318 0.7 10 0.0 47,926 100.0
Rhode Island 3,679 55.4 1,676 25.2 672 10.1 393 5.9 209 3.1 4 0.1 11 0.2 6,644 100.0
South Carolina 6,719 57.9 3,192 27.5 1,482 12.8 149 1.3 41 0.4 13 0.1 15 0.1 11,611 100.0
South Dakota 642 59.7 286 26.6 144 13.4 3 0.3 0 0.0 0 0.0 0 0.0 1,075 100.0
Tennessee @ 9,278 53.8 4,479 26.0 2,427 14.1 884 5.1 122 0.7 23 0.1 37 0.2 17,250 100.0
Texas 48,783 53.7 20,331 22.4 10,396 11.5 6,156 6.8 3,917 4.3 1,089 1.2 108 0.1 90,780 100.0
Utah 2,612 66.2 747 18.9 281 7.1 149 3.8 151 3.8 0 0.0 5 0.1 3,945 100.0
Vermont 1,530 59.3 672 26.0 267 10.3 98 3.8 11 0.4 2 0.1 0 0.0 2,580 100.0
Virginia @ 15,538 54.9 8,234 29.1 3,096 10.9 759 2.7 400 1.4 131 0.5 127 0.4 28,285 100.0
Washington @ 14,691 53.3 6,759 24.5 2,756 10.0 1,617 5.9 1,171 4.2 446 1.6 118 0.4 27,558 100.0
West Virginia 966 36.9 907 34.6 473 18.1 136 5.2 44 1.7 1 0.0 92 3.5 2,619 100.0
Wisconsin ++ 6,821 48.7 3,754 26.8 1,701 12.1 966 6.9 647 4.6 115 0.8 0 0.0 14,004 100.0
Wyoming 105 41.5 124 49.0 24 9.5 0 0.0 0 0.0 0 0.0 0 0.0 253 100.0
Total 389,569 51.2 181,338 23.8 86,252 11.3 47,000 6.2 30,777 4.0 9,309 1.2 16,713 2.2 760,958 100.0
--------------------------------------------------------------------------------------------------------------------------------------------------------------------------------------------------------------
* Data for legal abortions obtained at <= 8 weeks of gestation are presented in Table 11 by single weeks of gestation.
+ Data from 39 states, the District of Columbia, and New York City; excludes one state where unknown gestational age was >15%.
& Percentages may not add to 100. 0 due to rounding.
@ Weeks of gestation were based on physicians' estimates.
** Number obtained at � 12 weeks of gestation was redistributed based on the national average.
++ Includes residents only.
&& Includes 16-19 weeks only.
@@ Includes gestation of >= 20 weeks.
==============================================================================================================================================================================================================
Return to top. Table_10 Note: To print large tables and graphs users may have to change their printer settings to landscape and use a small font size.
TABLE 10. Reported legal abortions, by weeks of gestation* and state of occurrence -- selected states,+ United States, 1994
=====================================================================================================================================================================================================
                                                                                               Weeks of gestation
                             ----------------------------------------------------------------------------------------------------------------------------------------------------
                                         <=8                       9-10            11-12              13-15                16-20                >=21                 Unknown            Total &
                             --------------------------     --------------   ---------------    -----------------      -------------      -------------         -----------------   -----------------
State                           No.                   %         No.      %       No.      %         No.        %         No.     %           No.     %             No.       %        No.       %
-----------------------------------------------------------------------------------------------------------------------------------------------------------------------------------------------------
Alabama                       7,970                53.8       3,474   23.4     1,483   10.0       1,175      7.9         529   3.6           124   0.8              70     0.5     14,825   100.0
Arizona @                     7,339                52.7       3,384   24.3     1,315    9.4         840      6.0         354   2.5            21   0.2             677     4.9     13,930   100.0
Arkansas                      3,186                54.1       1,314   22.3       547    9.3         375      6.4         269   4.6            18   0.3             176     3.0      5,885   100.0
Colorado                      3,128                32.6       3,548   37.0     1,490   15.5         786      8.2         484   5.1           124   1.3              24     0.3      9,584   100.0
Connecticut @                 7,963 **             54.0       3,485** 23.6     1,623*  11.0       1,128      7.6         244   1.7             6   0.0             308     2.1     14,757   100.0
Georgia @                    17,078                47.0       8,871   24.4     4,572   12.6       2,452      6.7       2,024   5.6         1,217   3.3             160     0.4     36,374   100.0
Hawaii @                      2,835                49.0       1,441   24.9       681   11.8         290      5.0         287   5.0            58   1.0             191     3.3      5,783   100.0
Idaho                           480                45.8         345   33.0       162   15.5          41      3.9          13   1.2             6   0.6               0     0.0      1,047   100.0
Indiana                       8,647                69.2       2,383   19.1       919    7.4         246      2.0         102   0.8             0   0.0             202     1.6     12,499   100.0
Kansas @                      5,523                52.8       1,619   15.5     1,013    9.7         611      5.8         532   5.1           854   8.2             316     3.0     10,468   100.0
Kentucky                      3,999                49.1       1,597   19.6       923   11.3         572      7.0         543   6.7           179   2.2             332     4.1      8,145   100.0
Louisiana                     4,954                40.8       3,646   30.0     1,494   12.3       1,068      8.8         660   5.4           233   1.9              99     0.8     12,154   100.0
Maine @                       1,653                53.5         929   30.1       374   12.1          33      1.1          26   0.8             3   0.1              71     2.3      3,089   100.0
Maryland @                    9,727                55.2       4,229   24.0     2,143   12.2       1,024      5.8         485   2.8             1   0.0              18     0.1     17,627   100.0
Michigan                     19,824                60.0       6,052   18.3     3,024    9.1       2,412      7.3       1,497   4.5           225   0.7              27     0.1     33,061   100.0
Minnesota                     8,518                60.7       2,367   16.9     1,411   10.1         792      5.6         587   4.2           111   0.8             241     1.7     14,027   100.0
Mississippi                   1,845                46.4       1,067   26.8       546   13.7         305      7.7         134   3.4            27   0.7              55     1.4      3,979   100.0
Missouri ++                   4,332                36.5       4,058   34.2     2,152   18.1         834      7.0         445   3.7            56   0.5               2     0.0     11,879   100.0
Montana @                     1,639                59.4         536   19.4       299   10.8         159      5.8          87   3.2            29   1.1              12     0.4      2,761   100.0
Nevada                        4,183                62.1       1,267   18.8       610    9.1         356      5.3         261   3.9             0   0.0              59     0.9      6,736   100.0
New Jersey                   17,215                51.7       6,473   19.4     2,143    6.4       3,426     10.3       3,147   9.5           467   1.4             415     1.2     33,286   100.0
New Mexico                    2,614                53.0         820   16.6       424    8.6         276      5.6         276   5.6            39   0.8             480     9.7      4,929   100.0
New York                     78,461                52.4      31,884   21.3    14,636    9.8       8,078      5.4       7,337   4.9         2,830   1.9           6,372     4.3    149,598   100.0
  City                       56,576                54.5      21,182   20.4     9,950    9.6       5,934      5.7       6,408   6.2         2,565   2.5           1,285     1.2    103,900   100.0
  State                      21,885                47.9      10,702   23.4     4,686   10.3       2,144      4.7         929   2.0           265   0.6           5,087    11.1     45,698   100.0
North Carolina               17,871                50.9       7,497   21.4     4,076   11.6       2,503      7.1         949   2.7            88   0.3           2,104     6.0     35,088   100.0
North Dakota @                  677                52.0         351   27.0       148   11.4         113      8.7           9   0.7             1   0.1               2     0.2      1,301   100.0
Oregon @                      6,832                51.0       2,794   20.9     1,213    9.1         636      4.7         503   3.8           186   1.4           1,228     9.2     13,392   100.0
Pennsylvania                 19,855                47.7      11,665   28.0     5,063   12.2       2,834      6.8       1,894   4.5           328   0.8               6     0.0     41,645   100.0
Rhode Island                  3,404                55.9       1,513   24.8       634   10.4         314      5.2         202   3.3            10   0.2              15     0.2      6,092   100.0
South Carolina                6,307                57.7       2,988   27.4     1,415   13.0         126      1.2          44   0.4            24   0.2              18     0.2     10,922   100.0
South Dakota                    602                61.0         237   24.0       141   14.3           2      0.2           5   0.5             0   0.0               0     0.0        987   100.0
Tennessee @                   9,317                55.3       4,163   24.7     2,525   15.0         657      3.9         109   0.6            29   0.2              37     0.2     16,837   100.0
Texas @                      49,342                55.3      18,890   21.2     9,659   10.8       5,962      6.7       3,958   4.4         1,297   1.5              77     0.1     89,185   100.0
Utah                          2,362                65.4         712   19.7       264    7.3         124      3.4         134   3.7             1   0.0              12     0.3      3,609   100.0
Vermont                       1,440                62.0         553   23.8       217    9.3         104      4.5           5   0.2             2   0.1               0     0.0      2,321   100.0
Virginia@                    14,769                56.0       7,703   29.2     2,722   10.3         560      2.1         391   1.5           108   0.4             116     0.4     26,369   100.0
Washington @                 13,483                51.9       6,446   24.8     2,640   10.2       1,567      6.0       1,169   4.5           449   1.7             211     0.8     25,965   100.0
West Virginia &&                536                25.7         953   45.7       343   16.5         208     10.0          41   2.0             1   0.0               3     0.1      2,085   100.0
Wisconsin @@                  6,293                49.2       3,348   26.2     1,641   12.8         857      6.7         543   4.2           108   0.8               0     0.0     12,790   100.0
Wyoming @                        87                50.0          78   44.8         8    4.6           1      0.6           0   0.0             0   0.0               0     0.0        174   100.0

Total                       376,290                52.6     164,680   23.0    76,693   10.7      43,847      6.1      30,279   4.2         9,260   1.3          14,136     2.0    715,185   100.0
-----------------------------------------------------------------------------------------------------------------------------------------------------------------------------------------------------
*  Data for legal abortions obtained at <=8 weeks of gestation are presented in Table 12 by single weeks of gestation.
+  Data from 39 states and New York City; excludes two states where unknown gestational age was >15%.
&  Percentages may not add to 100.0 due to rounding.
@  Weeks of gestation were based on physicians' estimates.
** Number obtained at <=12 weeks of gestation was redistributed based on the national average.
++ Weeks of gestation were based on physicians' estimates only if date of last menstrual period was unknown or unreliable.
&& Weeks of gestation were based on physicians' estimates only if date of last menstrual period was unknown.
@@ Includes residents only.
=====================================================================================================================================================================================================
Return to top. Table_11 Note: To print large tables and graphs users may have to change their printer settings to landscape and use a small font size. TABLE 11. Reported legal abortions obtained at |
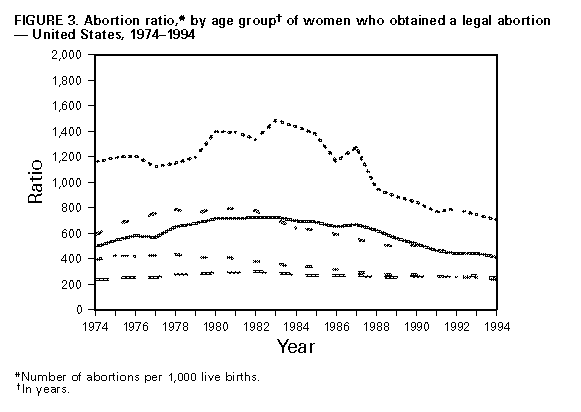 ">
"> ">
"> ">
"> ">
">