State and Local Youth Risk Behavior Surveillance System Coordinators
Site
Coordinator
Affiliation
Alabama
Judy Ryals, M.S.
Department of Education
Alaska
Tammy Green
Department of Health and Social Services
Arkansas
Kathleen Courtney, M.S.
Department of Education
Boston, Massachusetts
Nancy Strunk, M.S.
Boston Public Schools
Chicago, Illinois
Margaret Finnegan, M.A.
Chicago Public Schools
Connecticut
Norma Sinclair, Ph.D.
Department of Education
Dallas, Texas
Phyllis Simpson, Ph.D.
Dallas Independent School District
Delaware
Janet Arns, M.S.
Department of Education
Detroit, Michigan
Linda Leddick, Ph.D.
Detroit School District
District of Columbia
Linda Wright, M.A.
District of Columbia Public Schools
Florida
Lynda Kinard
Department of Education
Ft. Lauderdale, Florida
Mike Weissberg, M.S.
School Board of Broward County
Hawaii
Steve Nakasato, M.Ed.
Department of Education
Houston, Texas
Rose Haggerty
Houston Independent School District
Illinois
Glenn Steinhausen, Ph.D.
State Board of Education
Iowa
Sara Peterson, M.A.
Department of Education
Kentucky
Victoria Johnson, M.S.
Department of Education
Louisiana
Lillie Burns, M.Ed.
Department of Education
Maine
Joni Foster
Department of Education
Massachusetts
Carol Goodenow, Ph.D.
Department of Education
Miami, Florida
LaShaun Polk, M.P.H.
Dade County Public Schools
Michigan
Laurie Bechhofer, M.P.H.
Department of Education
Mississippi
Patricia Clemen
Department of Health
Missouri
Kevin Miller, M.A.
Department of Elementary and Secondary Education
Montana
Richard Chiotti
Office of Public Instruction
Nebraska
Jim Dills, M.A.
Department of Education
Nevada
Marianne Carr, M.A.
Department of Education
New Hampshire
Joyce Johnson, M.A.
Department of Education
New Jersey
Sarah Kleinman, M.P.H.
Department of Education
New Mexico
Dean Hopper
Department of Education
New Orleans, Louisiana
Charles Khoury
Orleans Parish School Board
New York
Rebecca Gardner, M.S.
Department of Education
New York City, New York
Mohamed Yasin, M.A., M.Ed.
New York City Board of Education
North Dakota
Linda Johnson, M.S.
Department of Public Instruction
Ohio
Becky Kennedy Koch, M.Ed.
Department of Education
Palm Beach, Florida
Barbara Marrese, M.S.
School District of Palm Beach County
Philadelphia, Pennsylvania
Betty Ann Creighton
School District of Philadelphia
San Bernardino, California
Dorothea Williams, M.A.
San Bernardino City Unified School District
San Diego, California
Ellen Hohenstein, M.A.
San Diego Unified School District
San Francisco, California
Trisch Bascom, M.A.
San Francisco Unified School District
Seattle, Washington
Pamela Hillard, M.P.A.
Seattle Public Schools
South Carolina
Robert Valois, Ph.D.
Department of Education
South Dakota
Patricia Stewart
Department of Education and Cultural Affairs
Tennessee
Jerry Swaim, M.S.
Department of Education
Utah
Jacqueline Morasco, M.S.
Office of Education
Vermont
Nancy Emberley, M.A.T.
Department of Education
West Virginia
Dean Lee
Department of Education
Wisconsin
Brian Weaver
Department of Public Instruction
Wyoming
Carol Peterson, M.S.
Department of Education
Youth Risk Behavior Surveillance --- United
States, 1999
Laura Kann, Ph.D.1 Steven A. Kinchen 1 Barbara I. Williams, Ph.D.2 James G. Ross, M.S.3 Richard Lowry, M.D., M.S.1 Jo Anne Grunbaum, Ed.D.1 Lloyd J. Kolbe, Ph.D.1 State and Local YRBSS Coordinators
1Division of Adolescent and School Health,National Center for Chronic Disease Prevention and Health Promotion, CDC
2Westat Incorporated, Rockville, Maryland 3Macro International, Calverton, Maryland
Abstract
Problem/Condition: Priority health-risk behaviors, which contribute to the
leading causes of mortality and morbidity among youth and adults, often are
established during youth, extend into adulthood, are interrelated, and are preventable.
Reporting Period: February--May 1999.
Description of the System: The Youth Risk Behavior Surveillance System
(YRBSS) monitors six categories of priority health-risk behaviors among youth and
young adults --- behaviors that contribute to unintentional and intentional injuries;
tobacco use; alcohol and other drug use; sexual behaviors that contribute to
unintended pregnancy and sexually transmitted diseases (STDs) (including
human immunodeficiency virus [HIV] infection); unhealthy dietary behaviors; and
physical inactivity. The YRBSS includes a national school-based survey conducted by CDC
as well as state, territorial, and local school-based surveys conducted by education
and health agencies. This report summarizes results from the national survey, 33
state surveys, and 16 local surveys conducted among high school students
during February--May 1999.
Results and Interpretation: In the United States, approximately three fourths of
all deaths among persons aged 10--24 years result from only four causes:
motor-vehicle crashes, other unintentional injuries, homicide, and suicide. Results from the
1999 national Youth Risk Behavior Survey demonstrate that numerous high
school students engage in behaviors that increase their likelihood of death from these
four causes --- 16.4% had rarely or never worn a seat belt; during the 30 days
preceding the survey, 33.1% had ridden with a driver who had been drinking alcohol; 17.3%
had carried a weapon during the 30 days preceding the survey; 50.0% had drunk
alcohol during the 30 days preceding the survey; 26.7% had used marijuana during the
30 days preceding the survey; and 7.8% had attempted suicide during the 12
months
preceding the survey. Substantial morbidity and social problems among
young persons also result from unintended pregnancies and STDs, including HIV
infection. In 1999, nationwide, 49.9% of high school students had ever had sexual
intercourse; 42.0% of sexually active students had not used a condom at last sexual
intercourse; and 1.8% had ever injected an illegal drug. Two thirds of all deaths among
persons aged >25 years result from only two causes --- cardiovascular disease and
cancer. The majority of risk behaviors associated with these two causes of death are
initiated during adolescence. In 1999, 34.8% of high school students had smoked
cigarettes during the 30 days preceding the survey; 76.1% had not eaten
>5 servings/day of fruits and vegetables during the 7 days preceding the survey; 16.0% were at risk
for becoming overweight; and 70.9% did not attend physical education class daily.
Actions Taken: These YRBSS data are already being used by health and
education officials at national, state, and local levels to analyze and improve policies
and programs to reduce priority health-risk behaviors among youth. The YRBSS data
also are being used to measure progress toward achieving 16 national health
objectives for 2010 and 3 of the 10 leading health indicators.
INTRODUCTION
In the United States, 72% of all deaths among youth and young adults aged
10--24 years result from only 4 causes --- motor-vehicle crashes (31%), other unintentional
injuries (11%), homicide (18%), and suicide (12%)
(1). Substantial morbidity and social problems also result from the approximately 1 million pregnancies that occur each
year among females aged 15--19 years (2) and the estimated 3 million cases of sexually
transmitted diseases (STDs) that occur each year among persons aged 10--9 years
(3).
Among adults aged >25 years, two thirds of all deaths in the United States
result from cardiovascular disease (42%) and cancer (24%)
(1). Leading causes of mortality and morbidity among all age groups in the United States are related to the following
six categories of health behavior: behaviors that contribute to unintentional and
intentional injuries; tobacco use; alcohol and other drug use; sexual behaviors that contribute
to unintended pregnancy and STDs, including human immunodeficiency virus (HIV)
infection; unhealthy dietary behaviors; and physical inactivity. These behaviors are
frequently interrelated and often are established during youth and extend into adulthood.
To monitor priority health-risk behaviors in each of these categories among
youth and young adults, CDC developed the Youth Risk Behavior Surveillance System
(YRBSS) (4). The YRBSS includes national, state, territorial, and local school-based surveys
of high school students. National surveys were conducted in 1990, 1991, 1993, 1995,
1997, and 1999.* Comparable state and local surveys were conducted as follows:
Year of Survey
Number of States
Number of Territories
Number of Large Cities
1990
23
0
9
1991
26
2
11
1993
40
2
14
1995
40
4
17
1997
38
4
17
1999
41
4
17
This report summarizes results from the 1999 national school-based survey and
trends during 1991--1999 in selected risk behaviors. Data from 33 state and 16 local
school-based surveys conducted during 1999 are included also.
METHODS
Sampling
The 1999 national school-based survey employed a three-stage cluster sample
design to produce a nationally representative sample of students in grades 9--12. The
first stage sampling frame contained 1,270 primary sampling units (PSUs), consisting of
large counties or groups of smaller, adjacent counties. From the 1,270 PSUs, 52 were
selected from 16 strata formed on the basis of the degree of urbanization and the relative
percentage of black** and Hispanic students in the PSU. PSUs were selected with
probability proportional to school enrollment size. At the second sampling stage, 187 schools
were selected with probability proportional to school enrollment size. To enable separate
analysis of data for black and Hispanic students, schools with substantial numbers of black
and Hispanic students were sampled at higher rates than all other schools. The third stage
of sampling consisted of randomly selecting one or two intact classes of a required
subject (e.g., English or social studies) from grades 9--12 at each chosen school. All students
in selected classes were eligible to participate in the survey.
A weighting factor was applied to each student record to adjust for nonresponse
and for varying probabilities of selection, including those resulting from oversampling
of black and Hispanic students. Numbers of students in other racial/ethnic populations
(excluding white, black, and Hispanic students) were too low for meaningful analysis in
this report. Weights were scaled so that a) the weighted count of students was equal to
the total sample size and b) the weighted proportions of students in each grade
matched national population proportions. National data are representative of students in
grades 9--12 in public and private schools in the 50 states and the District of Columbia.
SUDAAN was used to compute 95% confidence intervals, which were used to determine
differences between subpopulations at the p < 0.05 level
(5). Differences between prevalence estimates were considered statistically significant if the 95% confidence intervals did
not overlap. Secular trends were analyzed by using logistic regression analyses that
controlled for sex, grade, and race/ethnicity and that simultaneously assessed linear
and higher order (i.e., quadratic) time effects
(6). Quadratic trends indicate a significant
but nonlinear trend in the data. When the trend includes significant linear and
quadratic components, the data demonstrate certain nonlinear variation (e.g., leveling off or
change of direction) in addition to a linear trend.
The 1999 state and local school-based surveys employed a two-stage cluster
sample design to produce representative samples of students in grades 9--12 in their
jurisdictions. In the majority of states and cities, the first-stage sampling frame included all
public schools containing any of grades 9--12. Schools were selected with probability
proportional to school enrollment size. At the second sampling stage, intact classes of a
required subject or a required period (e.g., second period) were randomly selected.
All students in selected classes were eligible to participate in the survey. Certain states
and cities modified these procedures to meet their individual needs. For example,
either classes were selected as the first stage of sampling, or all schools, rather than a
sample of schools, were selected to participate.
For surveys from 22 states and 14 large cities, each with an overall response rate
of >60% and appropriate documentation, the data were weighted (Table 1). Weighted
data from the majority of these states and cities can be generalized to all public school
students in grades 9--12 in the respective jurisdiction. For surveys that did not have
an overall response rate of >60% and appropriate documentation, the data were
not weighted. Unweighted data from 11 states and 2 large cities apply only to
students participating in the survey. The Alaska survey excludes students from Anchorage;
the Louisiana survey excludes students from New Orleans; and the Tennessee survey
excludes students from Nashville. The New Jersey survey excludes 18% of the total
high school population studied in a separate survey.
For the national survey, 15,349 questionnaires were completed in 144 schools.
The school response rate was 77%, and the student response rate was 86%, resulting in
an overall response rate of 66% (Table 1). For state and local surveys, sample sizes
ranged from 1,058 to 7,125. School response rates ranged from 53% to 100%; student
response rates ranged from 55% to 90%; and overall response rates ranged from 40% to 85%.
In national, state, and local surveys, students were generally evenly distributed
across grades and between sexes.
Incidence rates for two variables were calculated to provide data for
monitoring relevant year 2000 national health objectives
(7). For weapon carrying, students who reported that they had carried a weapon 0 or 1 day during the 30 days preceding
the survey were assigned a weapon-carrying frequency of 0--1, respectively; 2--3 days,
2.5; 4--5 days, 4.5; and >6 days, 6.0. For physical fighting, students who reported having
fought 0--1 time during the 12 months preceding the survey were assigned a fighting
frequency of 0 or 1, respectively; 2--3 times, 2.5; 4--5 times, 4.5; 6--7 times, 6.5; 8--9 times, 8.5;
10--11 times, 10.5; and >12 times, 12.0.
Body mass index (BMI) was calculated from self-reported height and weight and
then applied to reference data from the National Health and Nutrition Examination Survey I
(8) to determine the percentage of students who were at risk for becoming overweight
and who were overweight. At risk for becoming overweight was defined as a BMI
>85th percentile and
<95th percentile by age and sex. Overweight was defined as a BMI
>95th percentile by age and sex. A BMI
>95th percentile by age and sex among youth is
approximately equivalent to a BMI >30 among adults. For an adult, a BMI of 30 is
approximately 30 pounds overweight.
Findings in this report are subject to two limitations. First, these data apply only
to youth who attend school and, therefore, are not representative of all persons in this
age group. Second, the extent of underreporting or overreporting of behaviors cannot
be determined, although the survey questions demonstrate good test-retest reliability
(9).
Data Collection
Survey procedures were designed to protect students' privacy by allowing for
anonymous and voluntary participation. Students completed the self-administered
question
naire in their classrooms during a regular class period, recording their responses
directly on a computer-scannable booklet or answer sheet. The core questionnaire
contained 87 multiple-choice questions. State and local education agencies added or
deleted items to meet individual needs. Local parental permission procedures were
followed before survey administration.
RESULTS
Behaviors That Contribute to Unintentional Injuries
Seat Belt Use
Nationwide, 16.4% of students had rarely or never worn seat belts when riding in
a car or truck driven by someone else (Table 2). Overall, male students (20.8%)
were significantly more likely than female students (11.9%) to have rarely or never worn
seat belts. This significant sex difference was identified for white*** and Hispanic
students and students in grades 11 and 12. Prevalence across state surveys varied fourfold
from 8.3% to 33.4% (median: 19.1%) (Table 3). Across local surveys, prevalence varied
eightfold from 4.8% to 36.4% (median: 14.9%).
Motorcycle Helmet Use
Nationwide, 23.9% of students had ridden a motorcycle during the 12 months
preceding the survey. Of these students, 38.0% rarely or never wore a motorcycle
helmet (Table 2). Overall, male students (44.5%) were significantly more likely than female
students (26.6%) to have rarely or never worn a motorcycle helmet. This significant
sex difference was identified for white students and students in grades 9 and 10.
Overall, Hispanic students (49.9%) were significantly more likely than white students (33.8%)
to have rarely or never worn a motorcycle helmet. Hispanic female students (44.5%)
were significantly more likely than white female students (20.1%) to report this behavior.
Prevalence of rarely or never wearing a motorcycle helmet varied across state surveys
threefold from 21.4% to 72.4% (median: 43.4%) (Table 3). Across local surveys,
prevalence ranged from 30.6% to 63.5% (median: 41.6%).
Bicycle Helmet Use
Nationwide, 70.8% of students had ridden a bicycle during the 12 months
preceding the survey. Of these students, 85.3% rarely or never wore a bicycle helmet (Table 2). Overall, black students (91.9%) were significantly more likely than white students
(84.3%) to have rarely or never worn a bicycle helmet. Black female students (94.1%)
were significantly more likely than Hispanic and white female students (83.4% and
82.1%, respectively) to have rarely or never worn a bicycle helmet. Prevalence of rarely
or never wearing a bicycle helmet ranged from 59.8% to 96.3% (median: 90.8%)
across state surveys and from 53.1% to 95.2% (median 89.1%) across local surveys (Table 3).
Injurious Physical Activity
Nationwide, 37.7% of students had been treated by a doctor or nurse for
injuries sustained while exercising, playing sports, or being physically active during the 12
months preceding the survey (Table 2). Overall, male students (42.5%) were significantly
more likely than female students (32.7%) to have been injured while being physically
active. This significant sex difference was identified for all the racial/ethnic subpopulations
and for students in grades 9 and 12. Overall, white students (38.7%) were significantly
more likely than black students (32.6%) to have been injured while being physically
active. Female students in grade 9 (35.4%) were significantly more likely than female
students in grade 12 (26.1%) to report this behavior. Prevalence ranged from 32.8% to
44.6% (median: 38.5%) across state surveys and from 27.1% to 36.1% (median: 31.0%)
across local surveys (Table 3).
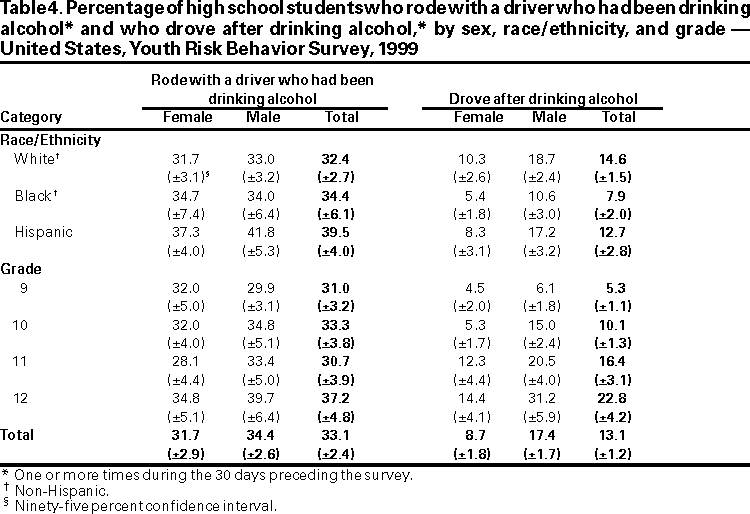
Riding with a Driver Who Had Been Drinking Alcohol
During the 30 days preceding the survey, one third (33.1%) of students
nationwide had ridden >1 times with a driver who had been drinking alcohol (Table 4). Overall,
Hispanic students (39.5%) were significantly more likely than white students (32.4%) to
have ridden with a driver who had been drinking alcohol. Hispanic male students (41.8%)
were significantly more likely than white male students (33.0%) to report this behavior.
Male students in grade 12 (39.7%) were significantly more likely than male students in grade
9 (29.9%) to have ridden with a driver who had been drinking alcohol. Prevalence
across state surveys ranged from 19.7% to 48.0% (median: 34.1%) and across local
surveys, from 18.1% to 39.1% (median: 31.4%) (Table 5).
Driving After Drinking Alcohol
During the 30 days preceding the survey, 13.1% of students nationwide had driven
a vehicle >1 times after drinking alcohol (Table 4). Overall, male students (17.4%)
were significantly more likely than female students (8.7%) to have driven after drinking
alcohol. This significant sex difference was identified for all the racial/ethnic
subpopulations and for students in grades 10 and 12. Overall, white students (14.6%) were
significantly more likely than black students (7.9%) to have driven after drinking alcohol. White
female students (10.3%) were significantly more likely than black female students (5.4%)
to have driven after drinking alcohol, and white and Hispanic male students (18.7%
and 17.2%, respectively) were significantly more likely than black male students (10.6%)
to report this behavior. Female students in grades 11 and 12 (12.3% and 14.4%,
respectively) were significantly more likely than female students in grades 9 and 10 (4.5%
and 5.3%, respectively) to have driven after drinking alcohol. Male students in grades 10,
11, and 12 (15.0%, 20.5%, and 31.2%, respectively) were significantly more likely than
male students in grade 9 (6.1%) to have driven after drinking alcohol, and male students
in grade 12 (31.2%) were significantly more likely than male students in grades 10 and
11 (15.0% and 20.5%, respectively) to report this behavior. Prevalence across state
surveys varied fourfold from 7.2% to 31.4% (median: 14.6%) (Table 5). Prevalence across
local surveys varied fivefold from 3.7% to 17.2% (median: 8.8%).
Behaviors That Contribute to Intentional Injuries
Carrying a Weapon
Nationwide, 17.3% of students had carried a weapon (e.g., a gun, knife, or club)
on >1 of the 30 days preceding the survey (Table 6). Overall, male students (28.6%)
were significantly more likely than female students (6.0%) to have carried a weapon. This
significant sex difference was identified for all the racial/ethnic and grade
subpopulations. Black and Hispanic female students (11.7% and 8.4%, respectively) were
significantly more likely than white female students (3.6%) to have carried a weapon. State
prevalence ranged from 10.8% to 24.0% (median: 17.7%), and local prevalence ranged from 10.0%
to 22.6% (median: 16.9%) (Table 7).
Nationwide, 4.9% of students had carried a gun on
>1 of the 30 days preceding the survey (Table 6). Overall, male students (9.0%) were significantly more likely than
female students (0.8%) to have carried a gun. This significant sex difference was
identified for all the racial/ethnic and grade subpopulations. State prevalence varied fourfold
from 2.4% to 9.3% (median: 6.7%), and local prevalence varied fivefold from 1.9% to
9.2% (median: 5.6%) (Table 7).
An estimated 70.8 separate incidents of weapon carrying had occurred per 100
students on >1 days during the 30 days preceding the survey (Table 6). Overall, the
weapon-carrying incident rate was significantly higher for male students (119.2/100
students) than for female students (22.7/100 students). This significant sex difference was
identified for white and Hispanic students and for students in all the grade
subpopulations. Black female students (43.2/100 students) had a significantly higher
weapon-carrying incident rate than white female students (12.0/100 students). State incidence rates
varied threefold from 37.7/100 students to 106.7/100 students (median: 70.7/100
students) (Table 7). Local incidence rates ranged from 38.5/100 students to 93.6/100
students (median: 63.5/100 students).
Physical Fighting
Among students nationwide, 35.7% had been in a physical fight
>1 times during the 12 months preceding the survey (Table 8). Overall, male students (44.0%) were
significantly more likely than female students (27.3%) to have been in a physical fight.
This significant sex difference was identified for white and Hispanic students and for all
the grade subpopulations. Overall, Hispanic students (39.9%) were significantly more
likely than white students (33.1%) to have been in a physical fight. Black female
students (38.6%) were significantly more likely than white female students (22.3%) to report
this behavior. Female and male students in grade 9 (32.5% and 49.5%, respectively)
were significantly more likely than female and male students in grade 11 (23.4% and
38.9%, respectively) to have been in a physical fight, and male students in grade 9 (49.5%)
were significantly more likely than male students in grade 12 (39.0%) to report this
behavior. Across state surveys, prevalence ranged from 26.2% to 39.3% (median: 32.7%)
(Table 9). Across local surveys, prevalence ranged from 23.4% to 45.4% (median: 37.9%).
Nationwide, 4.0% of students had been treated by a doctor or nurse for injuries
sustained in a physical fight >1 times during the 12 months preceding the survey (Table 8). Overall, male students (5.3%) were significantly more likely than female students
(2.8%) to have been injured in a physical fight. This significant sex difference was identified
for white students. Overall, black and Hispanic students (6.3% and 5.8%, respectively)
were
significantly more likely than white students (3.2%) to have been injured in a
physical fight. Black female students (6.6%) were significantly more likely than white female
students (1.6%) to report this behavior. Across state surveys, prevalence of injurious
physical fighting ranged from 2.3% to 5.2% (median: 3.8%) (Table 9). Across local
surveys, prevalence varied threefold from 2.4% to 7.3% (median: 5.0%).
Nationwide, an estimated 105.9 incidents of physical fighting had occurred per
100 students on >1 days during the 12 months preceding the survey (Table 8). Overall,
the physical fighting incident rate was significantly higher for male students (143.3/100
students) than for female students (68.0/100 students). This significant sex difference
was identified for white and Hispanic students and students in all the grade
subpopulations. Female students in grade 9 (94.9/100 students) had a significantly higher physical
fighting incidence rate than female students in grade 12 (45.1/100 students). State
incidence rates ranged from 83.7/100 students to 122.5/100 students (median: 100.7/100
students) (Table 9). Local incidence rates ranged from 72.1/100 students to 156.9/100
students (median: 117.1/100 students).
Dating Violence
During the 12 months preceding the survey, 8.8% of students nationwide were
hit, slapped, or physically hurt on purpose by their boyfriend or girlfriend (i.e., dating
violence) (Table 8). Overall, black students (12.4%) were significantly more likely than
white students (7.4%) to report dating violence. Black female students (14.1%) were
significantly more likely than white female students (7.4%) to report dating violence.
Prevalence of dating violence ranged from 7.1% to 13.1% (median: 10.6%) across state
surveys and from 6.5% to 15.9% (median: 11.1%) across local surveys (Table 9).
Forced Sexual Intercourse
Nationwide, 8.8% of students had ever been forced to have sexual intercourse
when they did not want to (Table 8). Female students (12.5%) were significantly more
likely than male students (5.2%) to have been forced to have sexual intercourse. This
significant sex difference was identified for white and Hispanic students and students in
grades 10, 11, and 12. Overall, black and Hispanic students (11.6% and 10.5%,
respectively) were significantly more likely than white students (6.7%) to have been forced to
have sexual intercourse. Across state surveys, prevalence for this behavior ranged from
5.8% to 11.7% (median: 9.0%) (Table 9). Across local surveys, prevalence ranged from 6.8%
to 15.2% (median: 10.0%).
School-Related Violence
Nationwide, 5.2% of students had missed
>1 days of school during the 30 days preceding the survey because they had felt unsafe at school or when traveling to or
from school (Table 10). Overall, Hispanic students (11.2%) were significantly more likely
than black and white students (6.0% and 3.9%, respectively) to have missed school
because they felt unsafe. Hispanic female students (10.2%) were significantly more likely
than white female students (4.3%) to have missed school because they felt unsafe, and
Hispanic male students (12.3%) were significantly more likely than black and white
male students (4.9% and 3.6%, respectively) to have missed school because they felt
unsafe. Prevalence across states varied ninefold from 1.9% to 16.4% (median: 5.4%) (Table 11). Prevalence across local surveys varied fivefold from 5.2% to 25.1% (median: 9.4%).
Prevalence of weapon carrying on school property on
>1 of the 30 days preceding the survey was 6.9% nationwide (Table 10). Overall, male students (11.0%) were
significantly more likely than female students (2.8%) to have carried a weapon on
school property. This significant sex difference was identified for white and Hispanic
students and all the grade subpopulations. Overall, Hispanic students (7.9%) were
significantly more likely than black students (5.0%) to have carried a weapon on school
property. Black female students (4.8%) were significantly more likely than white female
students (1.6%) to have carried a weapon on school property, and Hispanic and white male
students (12.3% and 11.0%, respectively) were significantly more likely than black
male students (5.3%) to report this behavior. State prevalence varied threefold from 4.3%
to 11.9% (median: 7.3%), and local prevalence ranged from 4.9% to 10.8% (median:
7.2%) (Table 11).
Nationwide, prevalence of students who had been threatened or injured with
a weapon on school property >1 times during the 12 months preceding the survey
was 7.7% (Table 10). Overall, male students (9.5%) were significantly more likely than
female students (5.8%) to have been threatened or injured with a weapon on school
property. This significant sex difference was identified for Hispanic students and students in
grade 10. Overall, Hispanic students (9.8%) were significantly more likely than white
students (6.6%) to have been threatened or injured with a weapon on school property.
Hispanic male students (13.1%) were significantly more likely than white male students (7.9%)
to report this behavior. Female students in grade 9 (8.4%) were significantly more
likely than female students in grade 12 (3.5%) to have been threatened or injured with
a weapon on school property, and male students in grade 9 (12.6%) were
significantly more likely than male students in grades 11 and 12 (7.0% and 6.6%, respectively) to
have been threatened or injured with a weapon on school property. Across state
surveys, prevalence ranged from 5.5% to 10.9% (median: 8.6%) (Table 11). Across local
surveys, prevalence varied threefold from 5.4% to 14.0% (median: 10.1%).
Nationwide, 14.2% of students had been in a physical fight on school property
>1 times during the 12 months preceding the survey (Table 10). Overall, male
students (18.5%) were significantly more likely than female students (9.8%) to have been in
a physical fight on school property. This significant sex difference was identified for
white and Hispanic students and students in grades 9, 10, and 11. Overall, black
students (18.7%) were significantly more likely than white students (12.3%) to have been in
a physical fight on school property. Black female students (18.4%) were significantly
more likely than white female students (7.1%) to have been in a physical fight on school
property. Female students in grade 9 (12.7%) were significantly more likely than
female students in grades 11 and 12 (7.1% and 6.0%, respectively) to have been in a
physical fight on school property, and male students in grades 9 and 10 (24.3% and 22.3%,
respectively) were significantly more likely than male students in grades 11 and 12 (14.4%
and 10.2%, respectively) to report this behavior. Across state surveys, prevalence
ranged from 9.6% to 15.9% (median: 12.9%) (Table 11). Across local surveys, prevalence
ranged from 8.9% to 21.3% (median: 14.8%).
Sadness and Suicide Ideation and Attempts
Nationwide, during the 12 months preceding the survey, 28.3% of students had felt
so sad or hopeless almost every day for
>2 weeks in a row that they stopped doing
some usual activities (Table 12). Overall, female students (35.7%) were significantly
more
likely than male students (21.0%) to have felt sad or hopeless almost every day for
>2 weeks. This significant sex difference was identified for all the racial/ethnic and
grade subpopulations. Overall, Hispanic students (37.0%) were significantly more likely
than black and white students (28.9% and 24.9%, respectively) to have felt sad or
hopeless almost every day for >2 weeks, and black students (28.9%) were significantly more
likely than white students (24.9%) to report this behavior. Hispanic female students
(46.1%) were significantly more likely than black and white female students (37.7% and
31.3%, respectively) to have felt sad or hopeless almost every day for
>2 weeks, and black female students (37.7%) were significantly more likely than white female students
(31.3%) to report this behavior. Hispanic male students (27.7%) were significantly more
likely than white male students (19.0%) to have felt sad or hopeless almost every day for
>2 weeks. Across state surveys, prevalence ranged from 22.9% to 34.9% (median:
27.4%) (Table 13). Across local surveys, prevalence ranged from 27.4% to 34.4% (median: 30.2%).
Nationwide, 19.3% of students had seriously considered attempting suicide
during the 12 months preceding the survey (Table 12). Overall, female students (24.9%)
were significantly more likely than male students (13.7%) to have considered attempting
suicide. This significant sex difference was identified for all the racial/ethnic
subpopulations and students in grades 9, 10, and 11. Overall, Hispanic students (19.9%) were
significantly more likely than black students (15.3%) to have considered attempting
suicide. Hispanic female students (26.1%) were significantly more likely than black female
students (18.8%) to have considered attempting suicide. Female students in grade
10 (30.1%) were significantly more likely than female students in grades 11 and 12
(23.0% and 21.2%, respectively) to have considered attempting suicide. Prevalence ranged
from 14.9% to 23.3% (median: 18.3%) across state surveys and from 12.7% to 22.3%
(median: 16.5%) across local surveys (Table 13).
More serious suicide ideation was reported by 14.5% of students nationwide
who, during the 12 months preceding the survey, had made a specific plan to attempt
suicide (Table 12). Overall, female students (18.3%) were significantly more likely than
male students (10.9%) to have made a suicide plan. This significant sex difference was
identified among white and Hispanic students and students in grades 9 and 10. Overall,
Hispanic students (17.7%) were significantly more likely than white and black
students (12.4% and 11.7%, respectively) to have made a suicide plan. Hispanic female
students (23.3%) were significantly more likely than white and black female students (15.5%
and 13.7%, respectively) to have made a suicide plan. Female students in grade 9
(20.1%) were significantly more likely than female students in grade 12 (13.0%) to have made
a suicide plan, and female students in grade 10 (22.7%) were significantly more likely
than female students in grades 11 and 12 (15.7% and 13.0%, respectively) to have made
a suicide plan. Prevalence across state surveys ranged from 11.6% to 18.5%
(median: 14.3%) (Table 13). Prevalence across local surveys ranged from 10.3% to 17.7%
(median: 12.8%).
Nationwide, 8.3% of students had attempted suicide
>1 times during the 12 months preceding the survey (Table 12). Overall, female students (10.9%) were
significantly more likely than male students (5.7%) to have attempted suicide. This significant
sex difference was identified among white and Hispanic students and students in grades
9 and 10. Overall, Hispanic students (12.8%) were significantly more likely than black
and white students (6.7% and 7.3%, respectively) to have attempted suicide. Hispanic
female students (18.9%) were significantly more likely than white and black students (9.0%
and
7.5%, respectively) to have attempted suicide. Female students in grades 9 and 10
(14.0% and 14.8%, respectively) were significantly more likely than female students in
grades 11 and 12 (7.5% and 5.8%, respectively) to report this behavior. The percentage
of students attempting suicide ranged from 5.2% to 10.1% (median: 7.5%) across
state surveys and from 6.5% to 9.8% (median: 7.7%) across local surveys (Table 13).
Nationwide, 2.6% of students made a suicide attempt during the 12 months
preceding the survey that resulted in an injury, poisoning, or overdose that had to be treated
by a doctor or nurse (Table 12). Hispanic female students (4.6%) were significantly
more likely than Hispanic male students (1.4%) to have made a suicide attempt that
required medical attention. Prevalence of injurious suicide attempts varied threefold from 1.5%
to 4.1% (median: 2.8%) across state surveys and from 1.8% to 4.8% (median: 3.1%)
across local surveys (Table 13).
Tobacco Use
Cigarette Use
Nationwide, 70.4% of students had ever tried cigarette smoking (even one or
two puffs) (i.e., lifetime cigarette use) (Table 14). Female students in grades 10, 11, and
12 (75.1%, 71.8%, and 75.5%, respectively) were significantly more likely than female
students in grade 9 (60.3%) to have ever tried cigarette smoking. Male students in grade
12 (80.5%) were significantly more likely than male students in grades 9 and 11 (63.1%
and 68.1%, respectively) to report this behavior. State prevalence ranged from 39.2%
to 77.3% (median: 70.4%), and local prevalence ranged from 55.6% to 69.4%
(median: 62.8%) (Table 15).
One quarter of students (25.3%) nationwide had ever smoked
>1 cigarettes every day for 30 days (i.e., lifetime daily cigarette use) (Table 14). Overall, white students
(29.3%) were significantly more likely than Hispanic and black students (19.6% and 11.2%,
respectively) to report lifetime daily cigarette use. White female students (29.2%)
were significantly more likely than Hispanic and black female students (18.2% and 8.0%,
respectively) to report lifetime daily cigarette use, and Hispanic female students
(18.2%) were significantly more likely than black female students (8.0%) to do so. Female
students in grades 10, 11, and 12 (27.7%, 26.9%, and 28.8%, respectively) were
significantly more likely than female students in grade 9 (17.3%) to report lifetime daily cigarette
use. Male students in grade 12 (34.3%) were significantly more likely than male students
in grade 9 (19.7%) to report lifetime daily cigarette use. Across state surveys,
prevalence varied threefold from 11.7% to 32.6% (median: 25.4%) (Table 15). Across local
surveys, prevalence ranged from 10.2% to 19.9% (median: 12.8%).
Approximately one third of students (34.8%) had smoked cigarettes on
>1 of the 30 days preceding the survey (i.e., current cigarette use) (Table 14). Overall, white
and Hispanic students (38.6% and 32.7%, respectively) were significantly more likely
than black students (19.7%) to report current cigarette use. This significant racial/ethnic
difference was identified among both female and male students. Female students in grade
12 (40.5%) were significantly more likely than female students in grade 9 (29.2%) to
report current cigarette use. Male students in grade 12 (45.2%) were significantly more
likely than male students in grades 9 and 10 (26.1% and 33.6%, respectively) to report
current cigarette use. Across state surveys, prevalence varied fourfold from 11.9% to
43.6%
(median: 34.1%) (Table 15). Across local surveys, prevalence ranged from 17.0% to
29.0% (median: 22.4%).
Nationwide, 16.8% of students had smoked cigarettes on
>20 of the 30 days preceding the survey (i.e., current frequent cigarette use) (Table 14). Overall, white
students (20.2%) were significantly more likely than Hispanic and black students (10.4% and
7.0%, respectively) to report current frequent cigarette use. This significant racial/ethnic
difference was identified for both female and male students. For both female and male
students, students in grades 11 and 12 were significantly more likely than students in
grade 9 to report current frequent cigarette use. Across state surveys, prevalence varied
fourfold from 5.6% to 24.0% (median: 17.4%) (Table 15). Across local surveys,
prevalence varied threefold from 5.0% to 12.5% (median: 6.6%).
Nationwide, 5.2% of students who reported current cigarette use, smoked >10
cigarettes/day on the days they smoked (Table 14). White male students (8.4%) were
significantly more likely than white female students (4.9%) to smoke >10 cigarettes/day.
Overall, white and Hispanic students (6.6% and 2.7%, respectively) were significantly more
likely than black students (0.9%) to smoke >10 cigarettes/day, and white students (6.6%)
were significantly more likely than Hispanic students (2.7%) to report this behavior.
White female students (4.9%) were significantly more likely than black female students
(1.0%) to smoke >10 cigarettes/day. White and Hispanic male students (8.4% and 3.5%,
respectively) were significantly more likely than black male students (0.8%) to smoke
>10 cigarettes/day, and white male students (8.4%) were significantly more likely than
Hispanic male students (3.5%) to report this behavior. Male students in grade 12
(10.8%) were significantly more likely than male students in grade 9 (3.5%) to smoke >10
cigarettes/day. Prevalence varied eightfold from 1.4% to 11.0% (median: 5.3%) across
state surveys (Table 15). Prevalence varied fivefold across local surveys from 0.7% to
3.8% (median: 1.9%).
Smokeless Tobacco Use
Nationwide, 7.8% of students had used smokeless tobacco (chewing tobacco or
snuff) on >1 of the 30 days preceding the survey (i.e., current smokeless tobacco use)
(Table 16). Overall, male students (14.2%) were significantly more likely than female
students (1.3%) to report current smokeless tobacco use. This significant sex difference was
identified for white and black students and all grade subpopulations. Overall, white
students (10.4%) were significantly more likely than Hispanic and black students (3.9% and
1.3%, respectively) to report current smokeless tobacco use. White female students
(1.5%) were significantly more likely than black female students (0.2%) to report current
smokeless tobacco use, and white male students (18.8%) were significantly more likely
than Hispanic and black male students (6.1% and 2.5%, respectively) to report this
behavior. State prevalence varied eightfold from 2.2% to 18.2% (median: 8.3%), and local
prevalence varied fivefold from 1.1% to 5.2% (median: 2.5%) (Table 17).
Cigar Use
Nationwide, 17.7% of students had smoked cigars, cigarillos, or little cigars on
>1 of the 30 days preceding the survey (i.e., current cigar use) (Table 16). Overall, male
students (25.4%) were significantly more likely than female students (9.9%) to report
current cigar use. This significant sex difference was identified for white and
Hispanic students and all the grade subpopulations. Overall, white students (18.8%) were
signifi
cantly more likely than black students (13.7%) to report current cigar use. White
male students (28.3%) were significantly more likely than black male students (16.0%)
to report current cigar use. Male students in grades 11 and 12 (26.9% and 33.5%,
respectively) were significantly more likely than male students in grade 9 (18.3%) to report
this behavior. Across state surveys, prevalence varied fourfold from 7.0% to 24.5%
(median: 18.9%) (Table 17). Across local surveys, prevalence ranged from 8.3% to 19.3%
(median: 14.3%).
Current Tobacco Use
Nationwide, 32.8% of students had reported current cigarette use, current
smokeless tobacco use, or current cigar use (i.e., current tobacco use) (Table 16). Overall,
male students (37.6%) were significantly more likely than female students (27.9%) to
report current tobacco use. This significant sex difference was identified for white students
and students in grades 10, 11, and 12. Overall, white and Hispanic students (36.2%
and 31.3%, respectively) were significantly more likely than black students (20.9%) to
report current tobacco use. This significant racial/ethnic difference was identified for both
female and male students. Male students in grade 12 (47.5%) were significantly more
likely than male students in grades 9 and 10 (29.3% and 37.8%, respectively) to report
current tobacco use. Across state surveys, prevalence varied threefold from 14.5% to
49.4% (median: 40.1%) (Table 17). Across local surveys, prevalence ranged from 20.3%
to 32.6% (median: 24.9%).
Access to Cigarettes
Data regarding access to cigarettes are reported only for those students aged
<18 years who reported current cigarette use. Nationwide, 23.5% of these students
had purchased their cigarettes in a store or gas station during the 30 days preceding
the survey (Table 18). Overall, male students (29.7%) were significantly more likely
than female students (17.6%) to have purchased cigarettes in a store or gas station.
This significant sex difference was identified for white students. Among both female and
male students, students in grades 11 and 12 were significantly more likely than students
in grade 9 to have purchased cigarettes in a store or gas station. State prevalence
varied fivefold from 7.1% to 37.8% (median: 19.3%), and local prevalence varied fourfold
from 11.3% to 45.1% (median: 25.8%) (Table 19).
Approximately two thirds of students (69.6%) who purchased cigarettes in a store
or gas station had not been asked to show proof of age (Table 18). Black male
students (80.2%) were significantly more likely than Hispanic male students (46.5%) to have
not been asked to show proof of age. State prevalence ranged from 48.6% to 75.6%
(median: 63.8%), and local prevalence ranged from 59.8% to 70.1% (median: 64.8%) (Table 19).
Alcohol and Other Drug Use
Alcohol Use
Nationwide, 81.0% of students had had
>1 drinks of alcohol during their lifetime
(i.e., lifetime alcohol use) (Table 20). Overall, Hispanic students (83.4%) were
significantly more likely than black students (74.8%) to report lifetime alcohol use. White male
students (81.8%) were significantly more likely than black male students (73.8%) to
report
lifetime alcohol use. Female students in grade 12 (87.0%) were significantly more
likely than female students in grade 9 (74.5%) to report lifetime alcohol use. Male students
in grades 10 and 12 (82.4% and 89.6%, respectively) were significantly more likely
than male students in grade 9 (72.3%) to report lifetime alcohol use, and male students
in grade 12 (89.6%) were significantly more likely than male students in grade 11 (79.5%)
to report this behavior. Prevalence of lifetime alcohol use across state surveys ranged
from 43.9% to 86.1% (median: 80.8%) (Table 21). Prevalence across local surveys ranged
from 56.2% to 81.9% (median: 73.3%).
Half of all students (50.0%) nationwide had had
>1 drinks of alcohol on >1 of the
30 days preceding the survey (i.e., current alcohol use) (Table 20). Overall, Hispanic
and white students (52.8% and 52.5%, respectively) were significantly more likely than
black students (39.9%) to report current alcohol use. This significant racial/ethnic
difference was identified for male students. Female students in grade 12 (56.9%) were
significantly more likely than female students in grades 9 and 10 (41.0% and 46.8%, respectively)
to report current alcohol use. Male students in grade 12 (66.6%) were significantly
more likely than male students in grades 9, 10, and 11 (40.2%, 52.7%, and 53.5%,
respectively) to report current alcohol use, and male students in grades 10 and 11 (52.7% and
53.5%, respectively) were significantly more likely than male students in grade 9 (40.2%)
to report this behavior. Prevalence across state surveys varied threefold from 22.7%
to 60.5% (median: 49.8%) (Table 21). Across local surveys, prevalence ranged from
26.5% to 53.0% (median: 38.6%).
Nationwide, 31.5% of students had had
>5 drinks of alcohol on >1 occasions
during the 30 days preceding the survey (i.e., episodic heavy drinking) (Table 20). Overall,
male students (34.9%) were significantly more likely than female students (28.1%) to
report episodic heavy drinking. This significant sex difference was identified for white and
Hispanic students and students in grade 12. Overall, white and Hispanic students (35.8%
and 32.1%, respectively) were significantly more likely than black students (16.0%) to
report episodic heavy drinking. This significant racial/ethnic difference was identified for
both female and male students. For both female and male students, students in grades 10,
11, and 12 were significantly more likely than students in grade 9 to report episodic
heavy drinking. Male students in grade 12 (49.5%) were significantly more likely than
male students in grade 10 (33.4%) to report this behavior. Prevalence of episodic heavy
drinking varied threefold from 15.8% to 46.2% (median: 33.1%) across state surveys and
from 11.4% to 31.7% (median: 19.4%) across local surveys (Table 21).
Marijuana Use
Nationwide, 47.2% of students had used marijuana during their lifetime (i.e.,
lifetime marijuana use) (Table 20). Overall, male students (51.0%) were significantly more
likely than female students (43.4%) to report lifetime marijuana use. Female students in
grades 10, 11, and 12 (46.7%, 48.5%, and 53.2%, respectively) were significantly more
likely than female students in grade 9 (28.7%) to report lifetime marijuana use. Male
students in grade 12 (63.8%) were significantly more likely than male students in grades 9 and
11 (40.7% and 51.0%, respectively) to report lifetime marijuana use. Lifetime marijuana
use ranged from 24.1% to 57.1% (median: 44.6%) across state surveys and from 30.6%
to 48.6% (median: 41.3%) across local surveys (Table 21).
One fourth (26.7%) of students had used
marijuana >1 times during the 30 days
preceding the survey (i.e., current marijuana use) (Table 20). Overall, male students
(30.8%)
were significantly more likely than female students (22.6%) to report current
marijuana use. This significant sex difference was identified for Hispanic students. Current
marijuana use varied threefold across state surveys from 10.6% to 33.7% (median:
24.5%) (Table 21). Across local surveys, current marijuana use ranged from 15.2% to 27.3%
(median: 20.9%).
Cocaine Use
Nationwide, 9.5% of students had used a form of cocaine (e.g., powder,
"crack,"**** or
"freebase"†) during their lifetime (i.e., lifetime cocaine use) (Table 22). Overall,
Hispanic and white students (15.3% and 9.9%, respectively) were significantly more
likely than black students (2.2%) to report lifetime cocaine use, and Hispanic students
(15.3%) were significantly more likely than white students (9.9%) to report this behavior.
Hispanic and white female students (12.3% and 8.7%, respectively) were significantly
more likely than black female students (1.5%) to report lifetime cocaine use. Hispanic and
white male students (18.3% and 11.0%, respectively) were significantly more likely than
black male students (2.8%) to report lifetime cocaine use, and Hispanic male students
(18.3%) were significantly more likely than white male students (11.0%) to report this
behavior. Among both female and male students, students in grade 12 were significantly
more likely than students in grade 9 to report lifetime cocaine use. Prevalence for
lifetime cocaine use varied threefold across state surveys from 5.7% to 17.2% (median: 8.2%)
and varied fourfold across local surveys from 2.8% to 10.3% (median: 5.1%) (Table 23).
Nationwide, 4.0% of students had used a form of
cocaine >1 times during the 30 days preceding the survey (i.e., current cocaine use) (Table 22). Overall, male students
(5.2%) were significantly more likely than female students (2.9%) to report current cocaine
use. This significant sex difference was identified for white students. Overall, Hispanic
and white students (6.7% and 4.1%, respectively) were significantly more likely than
black students (1.1%) to report current cocaine use. Hispanic female students (5.4%)
were significantly more likely than black female students (1.1%) to report current cocaine
use. Hispanic and white male students (8.0% and 5.3%, respectively) were significantly
more likely than black male students (1.0%) to report current cocaine use. Current cocaine
use varied sixfold from 1.5% to 8.5% (median: 3.4%) across state surveys and varied
fourfold from 1.3% to 5.5% (median: 2.6%) across local surveys (Table 23).
Inhalant Use
Nationwide, 14.6% of students had sniffed glue, breathed the contents of
aerosol spray cans, or inhaled any paints or spray to get high during their lifetime (i.e.,
lifetime inhalant use) (Table 22). Overall, white and Hispanic students (16.4% and 16.1%,
respectively) were significantly more likely than black students (4.5%) to report lifetime
inhalant use. This significant racial/ethnic difference was identified for both female and
male students. Female students in grades 9 and 10 (18.2% and 16.9%, respectively)
were significantly more likely than female students in grade 12 (8.7%) to report lifetime
inhalant use. Prevalence across state surveys ranged from 11.8% to 20.4% (median:
15.0%) (Table 23). Prevalence across local surveys ranged from 6.1% to 13.1% (median: 8.8%).
Nationwide, 4.2% of students had used inhalants >1 times during the 30 days preceding the survey (i.e., current inhalant use) (Table 22). Overall, Hispanic and white
students (4.9% and 4.4%, respectively) were significantly more likely than black students (2.3%)
to report current inhalant use. This significant racial/ethnic difference was identified
for male students. Female students in grade 9 (7.2%) were significantly more likely
than female students in grades 11 and 12 (2.4% and 1.6%, respectively) to report
current inhalant use. Across state surveys, prevalence ranged from 3.0% to 6.7% (median:
4.3%) (Table 23). Across local surveys, prevalence varied threefold from 2.0% to 5.4%
(median: 3.2%).
Heroin Use
Nationwide, 2.4% of students had used heroin during their lifetime (i.e., lifetime
heroin use) (Table 24). Overall, male students (3.5%) were significantly more likely than
female students (1.3%) to report lifetime heroin use. This significant sex difference was
identified for white students and students in grade 12. Across state surveys, prevalence
varied threefold from 1.7% to 5.2% (median: 3.1%) (Table 25). Across local surveys,
prevalence varied fivefold from 1.0% to 5.3% (median: 2.8%).
Methamphetamine Use
Nationwide, 9.1% of students had used methamphetamines during their lifetime
(i.e., lifetime methamphetamine use) (Table 24). Overall, Hispanic and white students
(11.3% and 10.3%, respectively) were significantly more likely than black students (1.7%)
to report lifetime methamphetamine use. This significant racial/ethnic difference was
identified for both female and male students. Male students in grade 12 (12.4%) were
significantly more likely than male students in grade 9 (6.2%) to report lifetime
methamphetamine use. State prevalence varied threefold from 6.3% to 16.2% (median:
9.8%), and local prevalence varied sixfold from 1.9% to 10.5% (median: 5.1%) (Table 25).
Steroid Use
Nationwide, 3.7% of students had used illegal steroids (i.e., without a doctor's
prescription) during their lifetime (i.e., lifetime steroid use) (Table 24). Overall, male
students (5.2%) were significantly more likely than female students (2.2%) to report lifetime
steroid use. This significant sex difference was identified for white and black students
and students in grades 11 and 12. Overall, white students (4.1%) were significantly
more likely than black students (2.2%) to report lifetime steroid use. Hispanic female
students (3.4%) were significantly more likely than black female students (0.9%) to report
lifetime steroid use. Prevalence across state surveys varied threefold from 2.1% to 6.1%
(median: 4.3%) (Table 25). Across local surveys, prevalence varied fourfold from 1.4%
to 5.8% (median: 3.4%).
Injecting-Drug Use
Nationwide, 1.8% of students had injected illegal drugs during their
lifetime***** (i.e., lifetime injecting-drug use) (Table 24). Overall, male students (2.8%) were
significantly more likely than female students (0.7%) to report lifetime injecting-drug use.
This significant sex difference was identified for white students and students in grade
12. Prevalence of lifetime injecting-drug use varied threefold across state surveys from
1.5% to 4.5% (median: 2.4%) (Table 25). Across local surveys, prevalence varied
sevenfold from 0.6% to 4.1% (median: 1.5%).
Initiation of Risk Behaviors
Cigarette Smoking
One fourth (24.7%) of students nationwide had smoked a whole cigarette before
age 13 years (Table 26). Overall, male students (27.3%) were significantly more likely
than female students (22.1%) to have smoked a whole cigarette before age 13 years.
This significant sex difference was identified for white and Hispanic students. Overall,
white and Hispanic students (26.2% and 25.1%, respectively) were significantly more
likely than black students (14.4%) to have smoked a whole cigarette before age 13 years.
This significant racial/ethnic difference was identified for both female and male
students. Female students in grade 10 (27.6%) were significantly more likely than female
students in grade 12 (16.7%) to have smoked a whole cigarette before age 13 years. Across
state surveys, prevalence varied threefold from 13.1% to 33.7% (median: 26.7%) (Table 27). Across local surveys, prevalence ranged from 15.2% to 23.0% (median: 18.7%).
Alcohol Use
Nationwide, 32.2% of students had first drunk alcohol (more than a few sips)
before age 13 years (Table 26). Overall, male students (37.4%) were significantly more
likely than female students (26.8%) to have drunk alcohol before age 13 years. This
significant sex difference was identified for all the racial/ethnic subpopulations and students
in grades 11 and 12. Female students in grades 9 and 10 (37.7% and 30.9%,
respectively) were significantly more likely than female students in grades 11 and 12 (20.0%
and 16.0%, respectively) to have drunk alcohol before age 13 years. Prevalence across
state surveys ranged from 17.0% to 40.2% (median: 31.5%) (Table 27). Prevalence
across local surveys ranged from 25.4% to 36.6% (median: 31.5%).
Marijuana Use
Nationwide, 11.3% of students had tried marijuana before age 13 years (Table 26). Overall, male students (14.5%) were significantly more likely than female students
(8.0%) to have tried marijuana before age 13 years. This significant sex difference was
identified for white and Hispanic students and students in grades 9 and 11. Overall,
Hispanic students (13.9%) were significantly more likely than white students (9.4%) to have
tried marijuana before age 13 years. This significant racial/ethnic difference was identified
for male students. Prevalence across state surveys varied fourfold from 5.0% to
19.6%
(median: 11.7%). Across local surveys, prevalence ranged from 6.5% to 14.5%
(median: 12.0%) (Table 27).
Tobacco, Alcohol, and Other Drug Use on School Property
Nationwide, 14.0% of students had smoked cigarettes on school property
on >1 of the 30 days preceding the survey (Table 28). Overall, white and Hispanic students
(15.6% and 12.9%, respectively) were significantly more likely than black students (6.7%) to
have smoked cigarettes on school property. White female students (14.7%) were
significantly more likely than black female students (5.8%) to have smoked cigarettes on school
property, and white and Hispanic male students (16.5% and 15.3%, respectively) were
significantly more likely than black male students (7.7%) to report this behavior. Across
state surveys, prevalence varied threefold from 6.3% to 21.3% (median: 13.7%) (Table 29). Across local surveys, prevalence varied threefold from 4.9% to 16.4% (median: 9.0%).
Nationwide, 4.2% of students had used smokeless tobacco on school property
on >1 of the 30 days preceding the survey (Table 28). Overall, male students (8.1%)
were significantly more likely than female students (0.3%) to have used smokeless tobacco
on school property. This significant sex difference was identified for white students and
all the grade subpopulations. Overall, white and Hispanic students (5.9% and 2.5%,
respectively) were significantly more likely than black students (0.5%) to have used
smokeless tobacco on school property. White male students (11.4%) were significantly more
likely than Hispanic and black male students (3.5% and 0.9%, respectively) to report this
behavior. Prevalence of smokeless tobacco use on school property across state
surveys varied sevenfold from 1.5% to 10.7% (median: 4.5%) (Table 29). Prevalence across
local surveys varied fivefold from 0.6% to 3.0% (median: 1.4%).
Nationwide, 4.9% of students had had
>1 drinks of alcohol on school property
on >1 of the 30 days preceding the survey (Table 28). Overall, male students (6.1%) were
significantly more likely than female students (3.6%) to have drunk alcohol on school
property. This significant sex difference was identified for white and black students and students
in grades 11 and 12. Hispanic female students (6.7%) were significantly more likely
than white and black female students (3.4% and 2.6%, respectively) to have drunk alcohol
on school property. Prevalence across state surveys varied threefold from 3.1% to
10.8% (median: 5.7%) (Table 29). Prevalence across local surveys varied threefold from 3.4%
to 11.2% (median: 6.1%).
Nationwide, 7.2% of students had used marijuana on school
property >1 times during the 30 days preceding the survey (Table 28). Overall, male students (10.1%)
were significantly more likely than female students (4.4%) to have used marijuana on
school property. This significant sex difference was identified for white and Hispanic
students and students in grades 10 and 12. Overall, Hispanic students (10.7%) were
significantly more likely than white students (6.5%) to have used marijuana on school property.
This significant racial/ethnic difference was identified for female students. Prevalence
across state surveys varied threefold from 3.3% to 10.6% (median: 5.8%) (Table 29).
Prevalence across local surveys ranged from 4.9% to 11.2% (median: 7.0%).
Nationwide, 30.2% of students had been offered, sold, or given an illegal drug
on school property during the 12 months preceding the survey (Table 28). Overall,
male students (34.7%) were significantly more likely than female students (25.7%) to
have been offered, sold, or given an illegal drug on school property. This significant sex
difference was identified for white and Hispanic students and students in grades 10 and
12.
Overall, Hispanic students (36.9%) were significantly more likely than white and
black students (28.8% and 25.3%, respectively) to have been offered, sold, or given an
illegal drug on school property. This significant racial/ethnic difference was identified for
male students. Prevalence of being offered, sold, or given an illegal drug on school
property across state surveys ranged from 17.2% to 40.0% (median: 28.5%) (Table 29).
Prevalence across local surveys ranged from 19.5% to 40.6% (median: 30.6%).
Sexual Behaviors That Contribute to Unintended
Pregnancy and STDs, Including HIV Infection
Sexual Intercourse
Half (49.9%) of all students had had sexual intercourse during their lifetime (Table 30). Hispanic male students (62.9%) were significantly more likely than Hispanic female
students (45.5%) to have had sexual intercourse. Overall, black students (71.2%)
were significantly more likely than Hispanic and white students (54.1% and 45.1%,
respectively) to have had sexual intercourse. This significant racial/ethnic difference was
identified for both female and male students. Female students in grades 11 and 12
(53.8% and 65.8%, respectively) were significantly more likely than female students in grades
9 and 10 (32.5% and 42.6%, respectively) to have had sexual intercourse, and male
students in grade 12 (63.9%) were significantly more likely than male students in grades
9 and 11 (44.5% and 51.4%, respectively) to report this behavior. Prevalence ranged
from 38.1% to 60.3% (median: 44.9%) across state surveys (Table 31). Across local
surveys, prevalence ranged from 26.7% to 64.8% (median: 53.1%).
Nationwide, 8.3% of students had initiated sexual intercourse before age 13
years (Table 30). Overall, male students (12.2%) were significantly more likely than
female students (4.4%) to have initiated sexual intercourse before age 13 years. This
significant sex difference was identified for all the racial/ethnic subpopulations and students
in grades 9, 10, and 12. Overall, black students (20.5%) were significantly more likely
than Hispanic and white students (9.2% and 5.5%, respectively) to have initiated sexual
intercourse before age 13 years, and Hispanic students (9.2%) were significantly more
likely than white students (5.5%) to report this behavior. Black female students (11.4%)
were significantly more likely than white female students (3.5%) to have initiated sexual
intercourse before age 13 years. Black male students (29.9%) were significantly more
likely than Hispanic and white male students (14.2% and 7.5%, respectively) to have
initiated sexual intercourse before age 13 years, and Hispanic male students (14.2%) were
significantly more likely than white male students (7.5%) to report this behavior. Male
students in grades 9 and 10 (17.7% and 13.9%, respectively) were significantly more
likely than male students in grade 11 (7.8%) to have initiated sexual intercourse before age
13 years, and male students in grade 9 (17.7%) were significantly more likely than
male students in grade 12 (7.6%) to have done so. Across state surveys, prevalence
varied fivefold from 3.2% to 16.0% (median: 6.8%) (Table 31). Across local surveys,
prevalence varied sixfold from 3.6% to 20.3% (median: 12.3%).
Nationwide, 16.2% of all students had had sexual intercourse during their
lifetime with >4 sex partners (Table 30). Overall, male students (19.3%) were significantly
more likely than female students (13.1%) to have
had >4 sex partners. This significant
sex difference was identified for black and Hispanic students and students in grade 9 and
10. Overall, black students (34.4%) were significantly more likely than Hispanic and
white
students (16.6% and 12.4%, respectively) to have
had >4 sex partners. Black male students (48.1%) were significantly more likely than Hispanic or white male students
(23.0% and 12.1%, respectively) to have had
>4 sex partners, and Hispanic male students
(23.0%) were significantly more likely than white male students (12.1%) to report this
behavior. Female students in grade 12 (20.6%) were significantly more likely than female
students in grades 9 and 10 (7.9% and 10.1%, respectively) to have
had >4 sex partners, and female students in grade 11 (15.1%) were significantly more likely than female students in
grade 9 (7.9%) to report this behavior. Prevalence across state surveys varied threefold
from 9.7% to 25.7% (median: 13.9%) (Table 31). Prevalence across local surveys varied
fourfold from 7.0% to 29.5% (median: 18.9%).
Nationwide, 36.3% of all students had had sexual intercourse during the 3
months preceding the survey (i.e., currently sexually active) (Table 30). Overall, black
students (53.0%) were significantly more likely than Hispanic and white students (36.3%
and 33.0%, respectively) to be currently sexually active. This significant racial/ethnic
difference was identified for both female and male students. For both female and male
students, students in grade 12 were significantly more likely than students in grades 9,
10, and 11 to be currently sexually active. Female students in grade 11 (39.5%) were
significantly more likely than female students in grade 9 (24.0%) to be currently
sexually active. Prevalence across state surveys ranged from 26.1% to 44.8% (median:
32.0%) (Table 31). Prevalence across local surveys varied threefold from 18.2% to 47.8%
(median: 36.8%).
Among students who had had sexual intercourse during their lifetime, 27.3%
had been abstinent during the 3 months preceding the survey (i.e., currently abstinent)
(Table 30). Overall, male students (30.5%) were significantly more likely than female
students (23.9%) to be currently abstinent. This significant sex difference was identified for
Hispanic students. Prevalence across state surveys ranged from 23.7% to 37.8%
(median: 28.5%) and across local surveys from 25.7% to 34.1% (median: 30.7%) (Table 31).
Condom Use
Among currently sexually active students nationwide, 58.0% reported that
either they or their partner had used a condom during last sexual intercourse (Table 32).
Overall, male students (65.5%) were significantly more likely than female students (50.7%)
to report condom use. This significant sex difference was identified for white and
Hispanic students and students in grades 11 and 12. Overall, black students (70.0%) were
significantly more likely than Hispanic and white students (55.2% and 55.0%, respectively)
to report condom use. Black female students (64.5%) were significantly more likely
than white and Hispanic female students (47.6% and 43.0%, respectively) to report
condom use, and black male students (75.3%) were significantly more likely than white
male students (63.0%) to report condom use. Female students in grade 9 (63.1%) were
significantly more likely than female students in grade 12 (41.1%) to report condom use.
Prevalence across state surveys ranged from 47.1% to 64.8% (median: 57.7%) and
across local surveys from 54.4% to 74.2% (median: 65.3%) (Table 33).
Birth Control Pill Use
Among currently sexually active students nationwide, 16.2% reported that
either they or their partner had used birth control pills before last sexual intercourse (Table 32). Overall, female students (20.4%) were significantly more likely than male
students
(11.8%) to report birth control pill use. This significant sex difference was identified
for white and black students and students in grade 12. Overall, white students (21.0%)
were significantly more likely than Hispanic and black students (7.8% and 7.7%,
respectively) to report birth control pill use. This significant racial/ethnic difference was identified
for both female and male students. Female students in grade 12 (31.4%) were
significantly more likely than female students in grades 9, 10, and 11 (12.8%, 12.8%, and
18.4%, respectively) to report birth control pill use, and male students in grade 12 (17.3%)
were significantly more likely than male students in grade 10 (5.9%) to report this
behavior. Prevalence varied threefold from 12.5% to 33.2% (median: 18.6%) across state
surveys (Table 31). Prevalence varied threefold from 5.4% to 17.8% (median: 9.4%) across
local surveys (Table 33).
Alcohol or Drug Use at Last Sexual Intercourse
Among currently sexually active students nationwide, 24.8% had used alcohol
or drugs at last sexual intercourse (Table 32). Overall, male students (31.2%) were
significantly more likely than female students (18.5%) to have used alcohol or drugs at
last sexual intercourse. This significant sex difference was identified for all the
racial/ethnic subpopulations and students in grade 11. White female students (21.5%) were
significantly more likely than black female students (9.3%) to have used alcohol or drugs at
last sexual intercourse. Prevalence ranged from 20.4% to 34.5% (median: 26.4%)
across state surveys and from 15.4% to 29.2% (median: 18.4%) across local surveys (Table 33).
Pregnancy
Nationwide, 6.3% of students reported that they had been pregnant or had
gotten someone else pregnant (Table 32). Female students in grades 11 and 12 (8.1%
and 13.8%, respectively) were significantly more likely to have been pregnant than
male students in grades 11 and 12 (3.7% and 6.7%, respectively) were to have gotten
someone pregnant. Overall, black students (13.4%) were significantly more likely than
white students (4.3%) to have been pregnant or to have gotten someone pregnant. This
significant racial/ethnic difference was identified for both female and male students.
Female students in grade 12 (13.8%) were significantly more likely than female students
in grades 9 and 10 (4.8% and 4.9%, respectively) to have been pregnant. Prevalence
varied threefold from 2.8% to 8.4% (median: 5.0%) across state surveys (Table 33).
Prevalence varied fourfold from 3.7% to 13.7% (median: 6.8%) across local surveys.
HIV Education
Nationwide, 90.6% of students had been taught in school about acquired
immunodeficiency syndrome (AIDS) or HIV infection (Table 32). Overall, white students
(92.2%) were significantly more likely than Hispanic students (84.1%) to have received HIV
education in school. This racial/ethnic difference was identified for both female and
male students. Prevalence ranged from 81.6% to 93.3% (median: 89.5%) across state
surveys and from 81.4% to 91.5% (median: 88.2%) across local surveys (Table 33).
Dietary Behaviors
Overweight
Nationwide, 16.0% of students were at risk for becoming overweight (i.e, having
a BMI >85th percentile and
<95th percentile by age and sex.) (Table 34). Overall, male
students (17.5%) were significantly more likely than female students (14.4%) to be at risk
for becoming overweight. This significant sex difference was identified for white
students. Overall, black students (22.0%) were significantly more likely than white students
(14.4%) to be at risk for becoming overweight. Black and Hispanic female students (22.6%
and 18.3%, respectively) were significantly more likely than white female students (12.4%)
to be at risk for becoming overweight. Prevalence ranged from 10.2% to 18.0%
(median: 14.7%) across state surveys and from 12.0% to 21.0% (median: 16.8%) across local
surveys (Table 35).
Nationwide, 9.9% of students were overweight (i.e., having a
BMI >95th percentile by age and sex) (Table 34). Male students (11.9%) were significantly more likely than
female students (7.9%) to be overweight. This significant sex difference was identified for
white students and students in grade 10. Across state surveys, prevalence varied
threefold from 4.9% to 13.1% (median: 8.6%) (Table 35). Across local surveys, prevalence
ranged from 6.5% to 14.3% (median: 10.2%).
Nationwide, 30.0% of students thought they were overweight (Table 34).
Overall, female students (36.4%) were significantly more likely than male students (23.7%)
to consider themselves overweight. This significant sex difference was identified for all
the racial/ethnic subpopulations and students in grades 10, 11, and 12. Overall,
Hispanic students (36.7%) were significantly more likely than white and black students (29.2%
and 24.9%, respectively) to consider themselves overweight. Hispanic female
students (42.3%) were significantly more likely than black female students (32.3%) to
consider themselves overweight. Hispanic male students (30.8%) were significantly more
likely than white or black male students (23.0% and 17.1%, respectively) to consider
themselves overweight. Female students in grade 11 (40.2%) were significantly more
likely than female students in grade 9 (32.5%) to consider themselves overweight.
Across state surveys, prevalence ranged from 26.5% to 35.2% (median: 31.8%) (Table 35). Across local surveys, prevalence ranged from 20.3% to 34.9% (median: 27.5%).
Nationwide, 42.7% of students were trying to lose weight during the 30 days
preceding the survey (Table 34). Overall, female students (59.4%) were significantly more
likely than male students (26.1%) to be trying to lose weight. This significant sex difference
was identified for all the racial/ethnic and grade subpopulations. Overall, Hispanic and
white students (50.6% and 42.6%, respectively) were significantly more likely than black
students (36.3%) to be trying to lose weight, and Hispanic students (50.6%) were
significantly more likely than white students (42.6%) to report this behavior. Hispanic and
white female students (63.6% and 61.4%, respectively) were significantly more likely
than black female students (48.3%) to be trying to lose weight, and Hispanic male
students (37.3%) were significantly more likely than white and black male students (24.9%
and 23.6%, respectively) to report this behavior. Male students in grade 9 (29.7%)
were
significantly more likely than male students in grade 12 (19.9%) to be trying to lose
weight. Prevalence ranged from 37.1% to 49.1% (median: 43.3%) across state surveys and
from 34.6% to 46.1% (median: 39.5%) across local surveys (Table 35).
Consumption of Fruits and Vegetables
Nationwide, 23.9% of students had eaten
>5 servings/day of fruits and vegetables****** during the 7 days preceding the survey (Table 36). Across state
surveys, prevalence ranged from 14.1% to 32.2% (median: 21.1%) (Table 37). Across local
surveys, prevalence ranged from 19.9% to 28.6% (median: 24.5%).
Consumption of Milk
Nationwide, 18.0% of students drank >3 glasses/day of milk during the 7 days
preceding the survey (Table 36). Overall, male students (23.0%) were significantly more
likely than female students (12.9%) to have drunk
>3 glasses/day of milk. This significant
sex difference was identified for all the racial/ethnic subpopulations and students in grades
9, 10, and 12. Overall, white and Hispanic students (19.6% and 15.8%, respectively)
were significantly more likely than black students (10.8%) to have
drunk >3 glasses/day of milk. White female students (13.8%) were significantly more likely than black
female students (7.8%) to have drunk >3 glasses/day of milk, and white and Hispanic male
students (24.8% and 21.4%, respectively) were significantly more likely than black male
students (13.9%) to report this behavior. Female students in grades 9 and 10 (15.5%
and 14.2%, respectively) were significantly more likely than female students in grade 12
(7.5%) to have drunk >3 glasses/day of milk, and male students in grade 9 (28.7%) were
significantly more likely than male students in grades 11 and 12 (19.2% and 19.8%,
respectively) to report this behavior. Across state surveys, prevalence varied threefold
from 12.1% to 33.8% (median: 20.6%) (Table 37). Across local surveys, prevalence
ranged from 9.6% to 18.2% (median: 13.0%).
Attempted Weight Control
Nationwide, 58.4% of students had exercised to lose weight or to avoid gaining
weight during the 30 days preceding the survey (Table 38). Overall, female students
(67.4%) were significantly more likely than male students (49.5%) to have exercised to
lose weight or to avoid gaining weight. This significant sex difference was identified for
white and Hispanic students and students in all grade subpopulations. White female
students (70.0%) were significantly more likely than black female students (58.6%) to have
exercised to lose weight or to avoid gaining weight. Prevalence ranged from 50.4% to
62.7% (median: 57.9%) across state surveys and from 45.8% to 61.9% (median: 54.5%)
across local surveys (Table 39).
Nationwide, 40.4% of students had eaten less food, fewer calories, or foods low in
fat to lose weight or to avoid gaining weight during the 30 days preceding the survey
(Table 38). Overall, female students (56.1%) were significantly more likely than male
students (25.0%) to have eaten less food, fewer calories, or foods low in fat to lose weight or
to avoid gaining weight. This significant sex difference was identified for all the
racial/ethnic and grade subpopulations. Overall, white students (42.1%) were significantly more
likely than black students (34.5%) to have eaten less food, fewer calories, or foods low in fat
to lose weight or to avoid gaining weight. White female students (60.3%) were
significantly more likely than Hispanic and black female students (51.0% and 43.4%, respectively)
to
report this behavior. Prevalence ranged from 36.0% to 45.9% (median: 39.9%)
across state surveys and from 28.5% to 41.3% (median: 35.9%) across local surveys (Table 39).
Nationwide, 12.6% of students had gone without eating
for >24 hours to lose weight or to avoid gaining weight (Table 38). Overall, female students (18.8%) were
significantly more likely than male students (6.4%) to have gone without eating
for >24 hours to lose weight or to avoid gaining weight. This significant sex difference was identified for all
the racial/ethnic and grade subpopulations. Across state surveys, prevalence ranged
from 10.3% to 18.5% (median: 12.8%) (Table 39). Across local surveys, prevalence
ranged from 7.2% to 15.8% (median: 12.3%).
Nationwide, 7.6% of students had taken diet pills, powders, or liquids without
a doctor's advice to lose weight or to avoid gaining weight (Table 38). Overall, female
students (10.9%) were significantly more likely than male students (4.4%) to have taken
diet pills, powders, or liquids without a doctor's advice to lose weight or to avoid
gaining weight. This significant sex difference was identified for white students and students
in all the grade subpopulations. White female students (11.7%) were significantly
more likely than black female students (6.9%) to report this behavior. Across state
surveys, prevalence ranged from 4.7% to 11.1% (median: 7.7%) (Table 39). Across local
surveys, prevalence varied threefold from 3.3% to 10.4% (median: 6.1%).
Nationwide, 4.8% of students had vomited or taken laxatives to lose weight or
to avoid gaining weight (Table 38). Overall, female students (7.5%) were significantly
more likely than male students (2.2%) to have vomited or taken laxatives to lose weight or
to avoid gaining weight. This significant sex difference was identified for white students
and students in all the grade subpopulations. Hispanic and black male students (4.0%
and 3.4%, respectively) were significantly more likely than white male students (1.5%)
to have vomited or taken laxatives to lose weight or to avoid gaining weight.
Prevalence ranged from 3.2% to 7.7% (median: 5.1%) across state surveys and from 3.4% to
6.9% (median: 4.6%) across local surveys (Table 39).
Physical Activity
Vigorous and Moderate Physical Activity
Approximately two thirds (64.7%) of students nationwide had participated in
activities that made them sweat and breathe hard
for >20 minutes on >3 of the 7 days
preceding the survey (i.e., vigorous physical activity) (Table 40). Overall, male students
(72.3%) were significantly more likely than female students (57.1%) to report vigorous
physical activity. This significant sex difference was identified for all the racial/ethnic
subpopulations and students in grades 10, 11, and 12. Overall, white students (67.4%) were
significantly more likely than black students (55.6%) to report vigorous physical activity.
White female students (59.7%) were significantly more likely than Hispanic and black
female students (49.5% and 47.2%, respectively) to report vigorous physical activity.
Female students in grade 9 (68.0%) were significantly more likely than female students in
grades 10, 11, and 12 (56.2%, 49.2%, and 52.3%, respectively) to report this behavior.
Across state surveys, prevalence ranged from 55.2% to 77.0% (median: 63.5%) (Table 41). Across local surveys, prevalence ranged from 48.9% to 67.2% (median: 57.5%).
Approximately one quarter (26.7%) of students nationwide had participated in
activities that did not make them sweat or breathe hard
for >30 minutes on >5 of the 7
days preceding the survey (i.e., moderate physical activity) (Table 40). Overall, male
students
(29.0%) were significantly more likely than female students (24.4%) to report
moderate physical activity. This significant sex difference was identified for Hispanic
students. Overall, white students (28.8%) were significantly more likely than Hispanic and
black students (21.4% and 20.9%, respectively) to report moderate physical activity. This
significant racial/ethnic difference was identified for female students. Prevalence
ranged from 20.3% to 32.7% (median: 25.5%) across state surveys and from 17.0% to
29.2% (median: 20.8%) across local surveys (Table 41).
Strengthening Exercises
Nationwide, 53.6% of students had done strengthening exercises (e.g., push-ups,
sit-ups, and weightlifting) on >3 of the 7 days preceding the survey (Table 40). Overall,
male students (63.5%) were significantly more likely than female students (43.6%) to
have participated in strengthening exercises. This significant sex difference was identified
for all the racial/ethnic and grade subpopulations. Overall, white students (55.7%)
were significantly more likely than black students (45.1%) to have participated in
strengthening exercises. This significant racial/ethnic difference was identified for female
students. Female students in grade 9 (49.6%) were significantly more likely than female
students in grades 11 and 12 (38.0% and 40.3%, respectively) to report this behavior.
Prevalence ranged from 45.0% to 61.5% (median: 52.0%) across state surveys and from 40.3%
to 55.2% (median: 47.6%) across local surveys (Table 41).
Watching Television
Nationwide, 57.2% of students watched
television <2 hours/day during an
average school day (Table 40). Overall, white students (65.8%) were significantly more likely
than Hispanic or black students (47.8% and 26.3%, respectively) to have watched
television <2 hours/day, and Hispanic students (47.8%) were significantly more likely than black
students (26.3%) to report this behavior. This significant racial/ethnic difference was
identified for both female and male students. Female students in grade 12 (70.4%)
were significantly more likely than female students in grades 9 and 10 (51.6% and 55.2%,
respectively) to have watched television
<2 hours/day, and male students in grades 11
and 12 (62.5% and 63.3%, respectively) were significantly more likely than male students
in grade 9 (46.5%) to report this behavior. Across state surveys, prevalence ranged
from 42.7% to 80.7% (median: 61.9%) (Table 41). Across local surveys, prevalence ranged
from 33.4% to 64.4% (median: 43.4%).
Participation in Physical Education Class
Nationwide, 56.1% of students were enrolled in a physical education (PE) class
(Table 42). Female students in grade 9 (75.6%) were significantly more likely than female
students in grades 11 and 12 (36.8% and 29.4%, respectively) to be enrolled in a PE
class, and female students in grade 10 (56.6%) were significantly more likely than
female students in grade 12 (29.4%) to be enrolled in a PE class. Male students in grade 9
(82.3%) were significantly more likely than male students in grades 11 and 12 (44.6% and
43.8%, respectively) to be enrolled in a PE class. Prevalence of being enrolled in a PE class
across state surveys varied threefold from 29.1% to 93.3% (median: 46.6%) (Table 43).
Prevalence across local surveys ranged from 39.1% to 87.7% (median: 50.1%).
Nationwide, 29.1% of students attended PE class daily (Table 42). Female students
in grade 9 (40.3%) were significantly more likely than female students in grades 11 and
12
(16.6% and 16.6%, respectively) to attend PE class daily. Across state surveys,
prevalence varied ninefold from 6.5% to 61.1% (median: 26.9%) (Table 43). Across local
surveys, prevalence varied eightfold from 7.6% to 62.6% (median: 26.9%).
Among students enrolled in PE class, 76.3% exercised >20 minutes during an
average PE class (Table 42). Overall, male students (82.1%) were significantly more
likely than female students (69.6%) to have exercised >20 minutes during an average PE
class. This significant sex difference was identified for white and black students and students
in grades 9, 11, and 12. Overall, white students (78.7%) were significantly more likely
than black students (67.8%) to have exercised >20 minutes during an average PE class.
White and Hispanic female students (72.4% and 70.8%, respectively) were significantly
more likely than black female students (55.7%) to report this behavior. Prevalence ranged
from 64.5% to 89.0% (median: 80.1%) across state surveys and from 53.4% to 83.6%
(median: 68.6%) across local surveys (Table 43).
Participation on Sports Teams
Nationwide, 55.1% of students had played on sports teams during the 12
months preceding the survey (Table 42). Overall, male students (61.7%) were significantly
more likely than female students (48.5%) to have played on sports teams. This significant
sex difference was identified for all the racial/ethnic subpopulations and students in grades
9, 11, and 12. Overall, white students (56.9%) were significantly more likely than
Hispanic students (50.8%) to have played on sports teams. White female students (50.5%)
were significantly more likely than black female students (36.3%) to have played on
sports teams. Female students in grade 9 (53.4%) were significantly more likely than
female students in grade 12 (42.3%) to have played on sports teams. Prevalence ranged
from 49.5% to 68.0% (median: 57.7%) across state surveys and from 38.9% to 56.3%
(median: 47.9%) across local surveys (Table 43).
Trends During 1991--1999
Trend analyses of selected risk behaviors indicated significantly decreasing
linear trends (p < 0.05) during 1991-- or 1993--1999 in the percentage of students who never
or rarely wore a bicycle helmet, never or rarely wore seatbelts, rode with a driver who
had been drinking alcohol, carried a gun, carried a weapon at school, participated in a
physical fight, participated in a physical fight at school, ever had sexual intercourse, had
sexual intercourse before age 13 years, had sexual intercourse
with >4 partners, used birth control pills, and who attended physical education classes daily. The percentage of
students who carried a weapon decreased linearly, but also indicated a significant
quadratic trend suggesting leveling later in the decade.
Significant increasing linear trends during 1991--1999 were documented for
lifetime marijuana use, marijuana use before age 13 years, current cocaine use, condom
use, receiving HIV prevention education in school, and participating in strengthening
exercises. The percentage of students who reported current cigarette use increased
linearly, but also indicated a significant quadratic trend suggesting leveling or possible
decline later in the decade.
DISCUSSION
Since 1991, prevalence of several injury-related behaviors and sexual behaviors
have improved among high school students throughout the United States. Fewer
students are at risk for motor-vehicle crashes, homicide, unintended pregnancies, and
sexually transmitted diseases, including HIV infection. Although current cigarette smoking
was more common in 1999 than at the beginning of the decade, current cigarette
smoking rates have leveled or might be declining. Nonetheless, too many high school
students nationwide continue to practice behaviors that place them at risk for serious
health problems. Certain risk behaviors are more likely to be found among particular
subpopulations of students. For example, male students were more likely than female students
to report
rarely or never wearing seat belts;
rarely or never wearing motorcycle helmets;
being injured while exercising, playing sports, or being physically active;
driving after drinking alcohol;
weapon carrying;
gun carrying;
participating and being injured in a physical fight;
weapon carrying on school property;
being threatened or injured with a weapon on school property;
being in a physical fight on school property;
current smokeless tobacco use;
current cigar use;
episodic heavy drinking;
lifetime and current marijuana use;
current cocaine use;
lifetime heroin, illegal steroid, and injected drug use;
initiating cigarette, alcohol, and marijuana use before age 13 years;
smokeless tobacco, alcohol, and marijuana use on school property;
being offered, sold, or given an illegal drug on school property;
initiating sexual intercourse before age 13 years;
having had >4 sex partners during their lifetime;
alcohol or drug use at last sexual intercourse;
their partner not using birth control pills before last sexual intercourse; and
being at risk for overweight and being overweight.
In contrast, female students were more likely than male students to report
being forced to have sexual intercourse;
feeling sad or hopeless;
suicide-related behaviors;
their partner not using a condom at last sexual intercourse;
drinking <3 glasses/day of milk;
fasting to lose weight or control weight gain;
taking diet pills, powders, or liquids to lose weight or control weight gain;
taking laxatives or vomiting to lose weight or control weight gain;
not participating in vigorous or moderate physical activity;
not participating in strengthening exercises; and
not participating on sports teams.
White students were more likely than black students to report
being injured while exercising, playing sports, or being physically active;
driving after drinking alcohol;
regular cigarette use;
current cigarette use;
current frequent cigarette use;
smoking >10 cigarettes/day;
current smokeless tobacco use;
current cigar use;
current alcohol use;
episodic heavy drinking;
lifetime and current cocaine use;
lifetime and current inhalant use;
lifetime methamphetamine and illegal steroid use;
initiating cigarette use before age 13 years;
smoking cigarettes and using smokeless tobacco on school property; and
not using condoms.
White students were more likely than Hispanic students to report
regular cigarette use;
current frequent cigarette use;
smoking >10 cigarettes/day; and
current smokeless tobacco use.
Black students were more likely than white students to report
rarely or never wearing a bicycle helmet;
being injured in a physical fight;
dating violence;
being forced to have sexual intercourse;
participating in a physical fight on school property;
feeling sad or hopeless;
having had sexual intercourse during their lifetime;
initiating sexual intercourse before age 13 years;
having had >4 sex partners during their lifetime;
being currently sexually active;
not using birth control pills;
ever being pregnant or getting someone pregnant;
being at risk for overweight;
drinking <3 glasses/day of milk;
not participating in vigorous or moderate physical activity;
not participating in strengthening exercises;
watching television >2 hours/day; and
exercising <20 minutes during PE class.
Black students were more likely than Hispanic students to report
having had sexual intercourse during their lifetime;
initiating sexual intercourse before age 13 years;
having had >4 sex partners during their lifetime;
being currently sexually active;
drinking <3 glasses/day of milk; and
watching television >2 hours/day.
Hispanic students were more likely than white students to report
rarely or never wearing motorcycle helmets;
riding with a driver who had been drinking alcohol;
participating and being injured in a physical fight;
being forced to have sexual intercourse;
feeling too unsafe to go to school;
being threatened or injured with a weapon on school property;
feeling sad or hopeless;
planning or attempting suicide;
lifetime cocaine use;
initiating marijuana use before age 13 years;
marijuana use on school property;
being offered, sold, or given an illegal drug on school property;
initiating sexual intercourse before age 13 years;
not using birth control pills;
not being taught about HIV prevention in school;
not participating in moderate physical activity;
watching television >2 hours/day; and
not participating on sports teams.
Hispanic students were more likely than black students to report
feeling too unsafe to go to school;
weapon carrying on school property;
feeling sad or hopeless;
suicide-related behaviors;
current cigarette use;
lifetime and current alcohol use;
episodic heavy drinking;
smoking >10 cigarettes/day;
lifetime and current cocaine use;
lifetime and current inhalant use;
lifetime methamphetamine use;
initiating cigarette use before age 13 years;
cigarette smoking and smokeless tobacco use on school property;
being offered, sold, or given an illegal drug on school property; and
not using condoms.
These subgroup findings can assist in identifying the need for education and
services based on a higher prevalence of risk behaviors. However, underlying causes (e.g.,
economic factors, education levels, or cultural influences) for subgroup differences could
not be addressed in this analysis. The association between race/ethnicity and certain
risk behaviors is attenuated after controlling for socioeconomic status
(10). Additional research is needed to assess the effect of education, socioeconomic, cultural, and
racial/ethnic factors on prevalence of health-risk behaviors among youth.
Considerable variation in prevalence of risk behaviors also occurs from state to
state and from city to city. For example, across state surveys, a fivefold variation or
greater was identified for
feeling too unsafe to go to school;
smoking >10 cigarettes/day;
current smokeless tobacco use;
purchasing cigarettes at a store or gas station;
current cocaine use;
smokeless tobacco use on school property;
initiating sexual intercourse before age 13 years; and
attending PE class daily.
Across local surveys, a similar level of variation was found for
rarely or never wearing seatbelts;
driving after drinking alcohol;
carrying a gun;
feeling too unsafe to go to school;
smoking >10 cigarettes/day;
current smokeless tobacco use;
lifetime cocaine use;
lifetime heroin use;
lifetime methamphetamine use;
lifetime injecting-drug use;
smokeless tobacco use on school property;
initiating sexual intercourse before age 13 years; and
attending PE class daily.
These variations might occur, in part, because of differences in state and local
laws and policies, enforcement practices, access to illegal drugs, availability of effective
interventions, prevailing behavioral norms, and adult practices. However, further research
is needed to understand the impact of these factors on the prevalence of risk behaviors.
YRBSS continues to be the primary source of data regarding health-risk behaviors
of youth at national, state, and local levels. For example, YRBSS data will be used to
monitor 16 national health objectives for 2010 and 3 of 10 leading health indicators
(11). In Dallas, YRBSS data regarding lack of physical activity among high school students led
to development of an after-school physical education program. In Louisiana, YRBSS
data were used to help obtain funding for the Governor's Commission on Teen
Pregnancy Prevention. In Tennessee, YRBSS data were used by state legislators to craft the
Coordinated School Health Improvement Act. In Wisconsin, YRBSS data were published in
the state's medical journal to help educate new physicians regarding adolescent health
issues. In Hawaii, YRBSS data were used as the basis for development of a new
teaching guide for health education being used statewide. In Montana, YRBSS data were used
to help track state progress in reducing tobacco use. Continued support for YRBSS will
help ensure success of these and other public health and school health programs.
References
Hoyert DL, Kochanek KD, Murphy SL. Deaths: final data for 1997. National Vital
Statistics Reports 1999;47(19):1--105.
Ventura SJ, Mosher WD, Curtin SC, Abma JC, Henshaw S. Highlights of trends
in pregnancies and pregnancy rates by outcome: estimates for the United States, 1976--96.
National Vital Statistics Reports 1999;47(29):1--12.
Institute of Medicine, Committee on Prevention and Control of Sexually
Transmitted Diseases. Hidden epidemic: confronting sexually transmitted diseases. Eng TR,
Butler WT, eds. Washington, DC: National Academy Press, 1997.
Kolbe LJ, Kann L, Collins JL. Overview of the Youth Risk Behavior Surveillance
System. Public Health Rep 1993;108(suppl 1):2--10.
Shah BV, Barnwell BG, Bieler GS. SUDAAN: software for the statistical analysis of
correlated data, release 7.5, 1997 [user's manual]. Research Triangle Park, NC: Research
Triangle Institute; 1997.
Hinkle DE, Wiersma W, Jurs SG. Applied statistics for the behavioral sciences.
2nd ed. Boston, Massachusetts: Houghton Mifflin, 1988;383--9.
Public Health Service. Health people 2000: midcourse review and 1995
revisions. Washington, DC: US Department of Health and Human Services, Public Health
Service, 1995.
Must A, Dallal GE, Dietz WH. Reference data for obesity:
85th and 95th percentiles of
body mass index (wt/ht2) and triceps skinfold thickness. Am J Clin Nutr 1991;53:839--46.
Brener ND, Collins JL, Kann L, Warren CW, Williams BI. Reliability of the Youth
Risk Behavior Survey questionnaire. Am J Epidemiol 1995;141:575--80.
Lowry R, Kann L, Collins JL, Kolbe JL. Effect of socioeconomic status on chronic
disease risk behaviors among US adolescents. JAMA 1996;276:792-7.
US Department of Health and Human Services. Healthy people 2010 (conference
edition, in two volumes). Washington, DC: US Department of Health and Human Services, 2000.
* School-based components of YRBSS were implemented in 1990 and 1991 and biennially
during odd-numbered years thereafter.
† A process whereby cocaine is dissolved in ether or sodium hydroxide and the
precipitate filtered off.
** In this report, black students refers to black, non-Hispanic students.
*** In this report, white students refers to white, non-Hispanic students.
**** Pellet-sized pieces of highly purified cocaine.
***** Students were classified as injecting-drug users only if they a) reported injecting-drug
use not prescribed by a physician and b) answered one or more times to any of the following questions:
"During your life, how many times have you used any form of
cocaine including
powder, crack, or freebase?" "During your life, how many times have you used heroin
(also called smack, junk, or China White)?" "During your life, how many times have you
used methamphetamines (also called speed, crystal, crank, or ice)?" Or, "During your
life, how many times have you taken steroid pills or shots without a doctor's prescription?"
****** One hundred percent fruit juice, fruit, green salad, potatoes (excluding french fries,
fried potatoes, or potato chips), carrots, or other vegetables.
All MMWR HTML versions of articles are electronic conversions from ASCII text
into HTML. This conversion may have resulted in character translation or format errors in the HTML version.
Users should not rely on this HTML document, but are referred to the electronic PDF version and/or
the original MMWR paper copy for the official text, figures, and tables.
An original paper copy of this issue can be obtained from the Superintendent of Documents,
U.S. Government Printing Office (GPO), Washington, DC 20402-9371; telephone: (202) 512-1800.
Contact GPO for current prices.
**Questions or messages regarding errors in formatting should be addressed to
mmwrq@cdc.gov.