 |
|
|
|
|
|
|
| ||||||||||
|
|
|
|
|
|
|
||||
| ||||||||||
|
|
|
|
Surveillance for Characteristics of Health Education Among Secondary Schools --- School Health Education Profiles, 1998State and Local School Health Education Profiles Coordinators
Surveillance for Characteristics of Health Education Among Secondary Schools --- School Health Education Profiles, 1998Jo Anne Grunbaum, Ed.D.1 1Division of Adolescent and School Health, National Center for
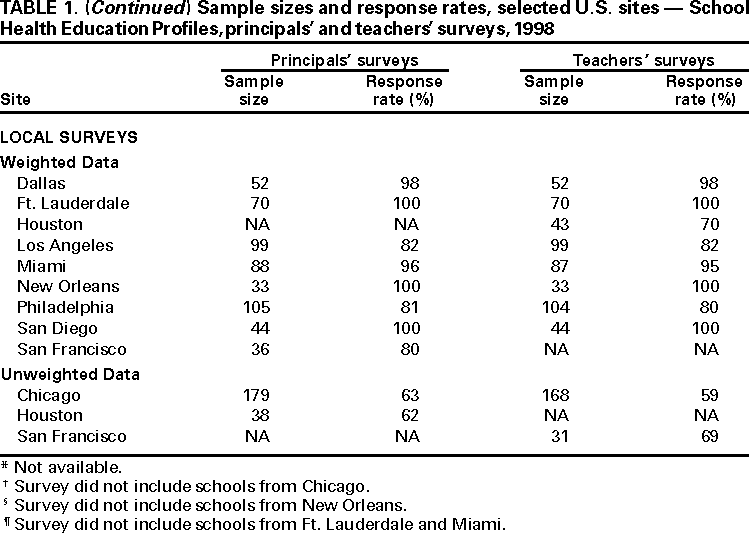
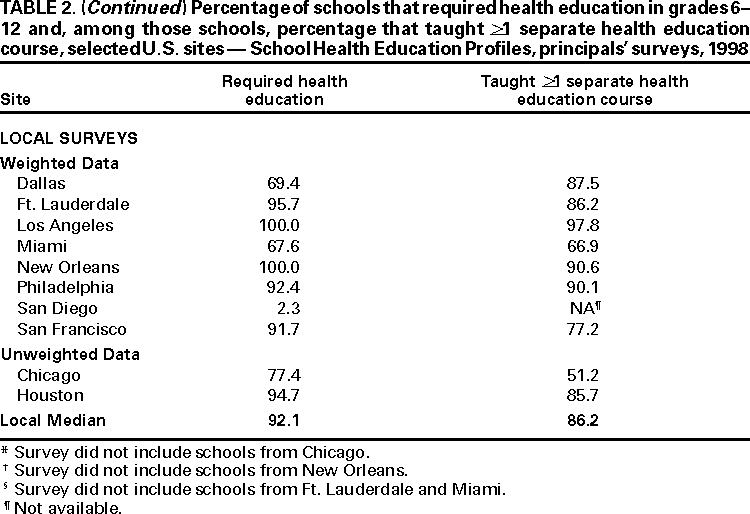
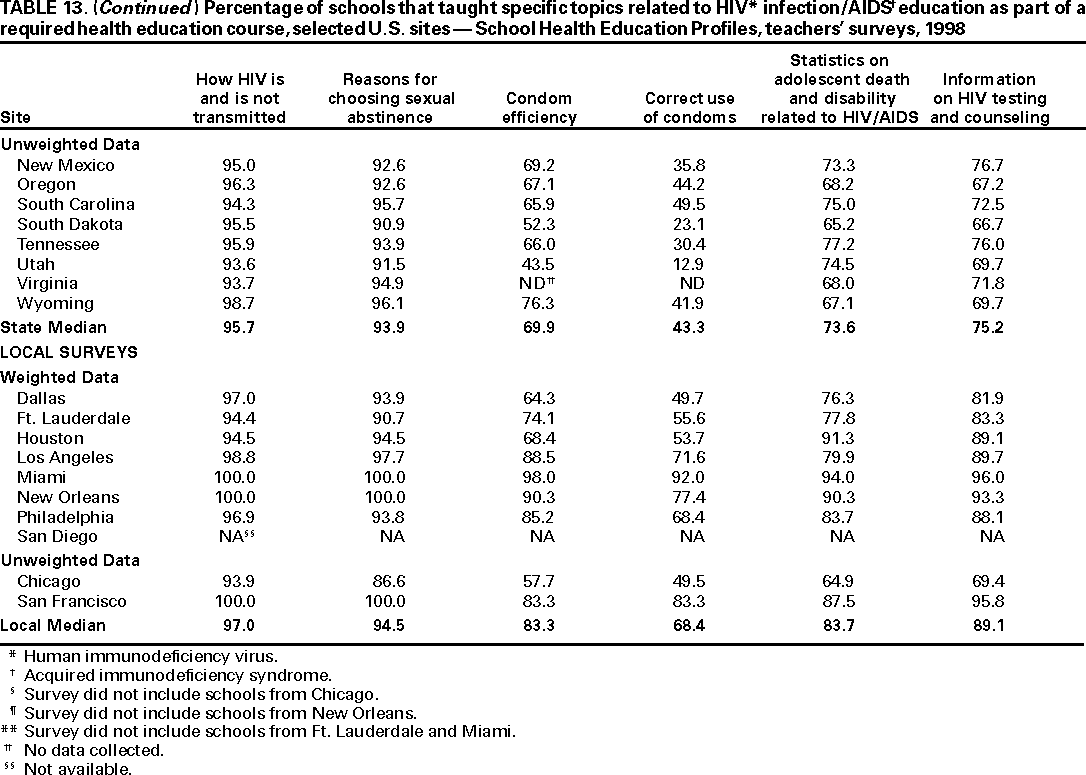
Chronic Disease Prevention and Health Promotion, CDC AbstractProblem/Condition: School health education (e.g., classroom instruction) is an essential component of school health programs; such education promotes the health of youth and improves overall public health. Reporting Period: February--May 1998. Description of System: The School Health Education Profiles monitor characteristics of health education in middle or junior high schools and senior high schools in the United States. The Profiles are school-based surveys conducted by state and local education agencies. This report summarizes results from 36 state surveys and 10 local surveys conducted among representative samples of school principals and lead health education teachers. The lead health education teacher coordinates health education policies and programs within a middle/junior high school or senior high school. Results: During the study period, most schools in states and cities that conducted Profiles required health education in grades 6--12. Of these, a median of 91.0% of schools in states and 86.2% of schools in cities taught a separate health education course. The median percentage of schools in each state and city that tried to increase student knowledge in selected topics (i.e., prevention of tobacco use, alcohol and other drug use, pregnancy, human immunodeficiency virus [HIV] infection, other sexually transmitted diseases, violence, or suicide; dietary behaviors and nutrition; and physical activity and fitness) was >73% for each of these topics. The median percentage of schools with a health education teacher who coordinated health education was 38.7% across states and 37.6% across cities. A median of 41.8% of schools across states and a median of 31.0% of schools across cities had a lead health education teacher with professional preparation in health and physical education, whereas a median of 6.0% of schools across states and a median of 5.5% of schools across cities had a lead health education teacher with professional preparation in health education only. A median of 19.3% of schools across states and 21.2% of schools across cities had a school health advisory council. The median percentage of schools with a written school or school district policy on HIV-infected students or school staff members was 69.7% across states and 84.4% across cities. Interpretation: Many middle/junior high schools and senior high schools require health education to help provide students with knowledge and skills needed for adoption of a healthy lifestyle. However, these schools might not be covering all important topic areas or skills sufficiently. The number of lead health education teachers who are academically prepared in health education and the number of schools with school health advisory councils needs to increase. Public Health Action: The Profiles data are used by state and local education officials to improve school health education. INTRODUCTIONSchool health education helps students develop knowledge and skills they need to avoid or modify behaviors related to the leading causes of death, illness, and injury both during youth and adulthood. The quality of school health education is determined, in part, by the curriculum planning and development process, teacher preparation, curriculum implementation, and assessment and evaluation (1), as well as the resources available to accomplish these tasks. Curriculum planning and development is enhanced when schools have a school health coordinator and collaborate with parents and community groups. Partnerships between schools and community groups contribute to successful school health programs, increased student knowledge, and improved skills (2). Health education teachers need to be academically prepared to teach health education and have opportunities for professional development to maintain and improve their knowledge and skills. Lack of teacher training is a serious obstacle to the implementation of effective school health education (3). Teachers who receive training implement health education curricula with more fidelity compared with teachers who do not receive training, resulting in more knowledge gain among students (4). Health education curricula should be planned, sequential, and implemented for all grades in elementary and middle/junior high schools and through >1 semester in senior high schools (1,5). Collaboration among health education teachers and other school staff members also improves the implementation of the health education curricula. To supplement the separate health education course, health-related information can be included in a range of disciplines, including physical education, the sciences, mathematics, language arts, social studies, home economics, and the arts (6). Evaluation of the health education curriculum should include assessment of student knowledge and skills. Assessment data should be used to improve curriculum development and implementation. In 1995, CDC collaborated with state and large local education agencies to develop the School Health Education Profiles to assess the status of school health education across states and cities. Data were collected in 1996 (7) and again in 1998. State and local education agencies have used these data to monitor characteristics of and assess trends in health education in middle/junior high schools and senior high schools in their jurisdiction. The Profiles include data from a questionnaire completed by each school's principal and a questionnaire completed by each school's lead health education teacher (i.e., the person who coordinates health education policies and programs within a middle/junior high school or senior high school). This report summarizes data from the 1998 Profiles (principals' surveys were conducted in 36 states and 10 cities; lead health education teachers' surveys were conducted in 35 states and 10 cities) and compares these data with the 1996 Profiles data. Education agencies repeated the Profiles in Spring 2000. METHODSSampling The Profiles employ systematic equal-probability sampling strategies to produce representative samples of schools serving students in grades 6--12 in each jurisdiction. In most states and cities, the sampling frame consists of all regular secondary public schools with >1 of grades 6--12. Some education agencies modify this procedure by inviting all schools, rather than just a sample, to participate. Data Collection At each school, data are collected during the spring semester. The principal's questionnaire and the lead health education teacher's questionnaire are both mailed to the principal of each sampled school. The principal determines who the lead health education teacher is and distributes the questionnaire accordingly. Completion of the survey is confidential and voluntary. Responses are recorded on the questionnaire booklet by the principal or teacher and returned directly to the state or local education agency. Follow-up telephone calls and written reminders are used to encourage participation. Data Analysis A weighting factor is applied to each record to reflect the likelihood of principals or teachers being selected and to adjust for differing patterns of nonresponse. Data from a state or city with an overall response rate of >70% and appropriate documentation were weighted, whereas data from a state or city that did not meet these criteria were not weighted. Weighted data are representative of all public schools serving grades 6--12 in the jurisdiction; unweighted data are representative only of the participating schools. Because of a low response rate, data from principals' surveys conducted in two states and lead health education teachers' surveys conducted in three states are not included in this report. Thus, this report represents information from 35 states with data from both principals' and lead health education teachers' surveys, one state with data from only the principals' survey, and 10 cities with data from both principals' and lead health education teachers' surveys (Table 1). Across states, the sample sizes of the principals' surveys ranged from 55 to 577, and the response rates ranged from 52% to 96%; across cities, the sample sizes ranged from 33 to 179, and the response rates ranged from 62% to 100% (Table 1). The sample sizes of the lead health education teachers' surveys across states ranged from 54 to 571, and the response rates ranged from 50% to 95%; across cities, the sample sizes ranged from 31 to 168, and the response rates ranged from 59% to 100%. SAS software was used to compute point estimates (8). Medians are presented for all states (i.e., those with weighted data and those with unweighted data combined) and for all cities (i.e., those with weighted data and those with unweighted data combined). The Wilcoxon rank-sum test was used to test for differences between 1996 and 1998 data across states and cities. This is a nonparametric analogue to a two-sample t-test. This statistical procedure a) rank ordered all sites for both years separately for states and cities; b) summed the ranks separately by year and for states and cities; and c) compared the rank sums separately for states and cities to determine if the distribution of the variable was the same for 1998 and 1996. Assuming that the percentages have an underlying continuous distribution, the distribution of ranks is approximately normal; therefore, a z-value was used as the test statistic. The distributions were considered significantly different at p < .05. RESULTSHealth Education Courses Required Health Education Across states, the median percentage of schools that required health education for students in grades 6--12 was 93.1% (range: 74.9%--100%) (Table 2). Across cities, the median percentage of schools that required health education for students in grades 6--12 was 92.1% (range: 2.3%--100%). Among schools that required health education, the median percentage that taught >1 separate health education course was 91.0% (range: 76.8%--100%) across states and 86.2% (range: 51.2%--97.8%) across cities. Curricula, Guidelines, and Frameworks for Required Health Education Courses The median percentage of schools with a required health education course (Table 3) that required teachers to use*
|